This study compares EEG signal quality between systems using active electrodes and active shielding technologies. Both methods were evaluated through alpha power detection during rest and visual evoked potentials (VEP) during stimulation. Results showed similar performance in signal quality, VEP response, and impedance values under controlled noise conditions, suggesting that both technologies are comparably effective in real-world EEG applications.
OVERVIEW
In this document, we report results from a comparison study that aimed to evaluate the EEG signal quality recorded in real-world settings, using an active and an actively shielded EEG system. We shed light on how well both these technologies can be employed to gather meaningful information from continuous EEG data by looking at two main measures - detection of alpha power during rest and the ability to derive visual evoked potentials during stimulation. Our results show that the performance of both active and actively shielded EEG systems is comparable under controlled noise conditions.
Background
Electroencephalography (EEG) plays a crucial role in measuring electrical activity in the brain. However, external noise significantly distorts these signals, hindering accurate interpretation. This noise can come from various sources, including electromagnetic interference (EMI) from power lines and movement artifacts caused by muscle activity or head movement.
Two key technologies are used by hardware manufacturers to minimize external noise in EEG recordings:
Active Shielding: This technology employs shielded wires around each electrode to minimize noise (Figure 1). The EEG signal travels from the source to the amplifier where it gets pre-amplified and sent back to the shield. Since the core cable and the shield have an identical electrical signature a zero-capacitance effect is created. As a result, the shield absorbs the environmental noise, and the core cable is protected. The result is a cleaner EEG recording with reduced artifacts.
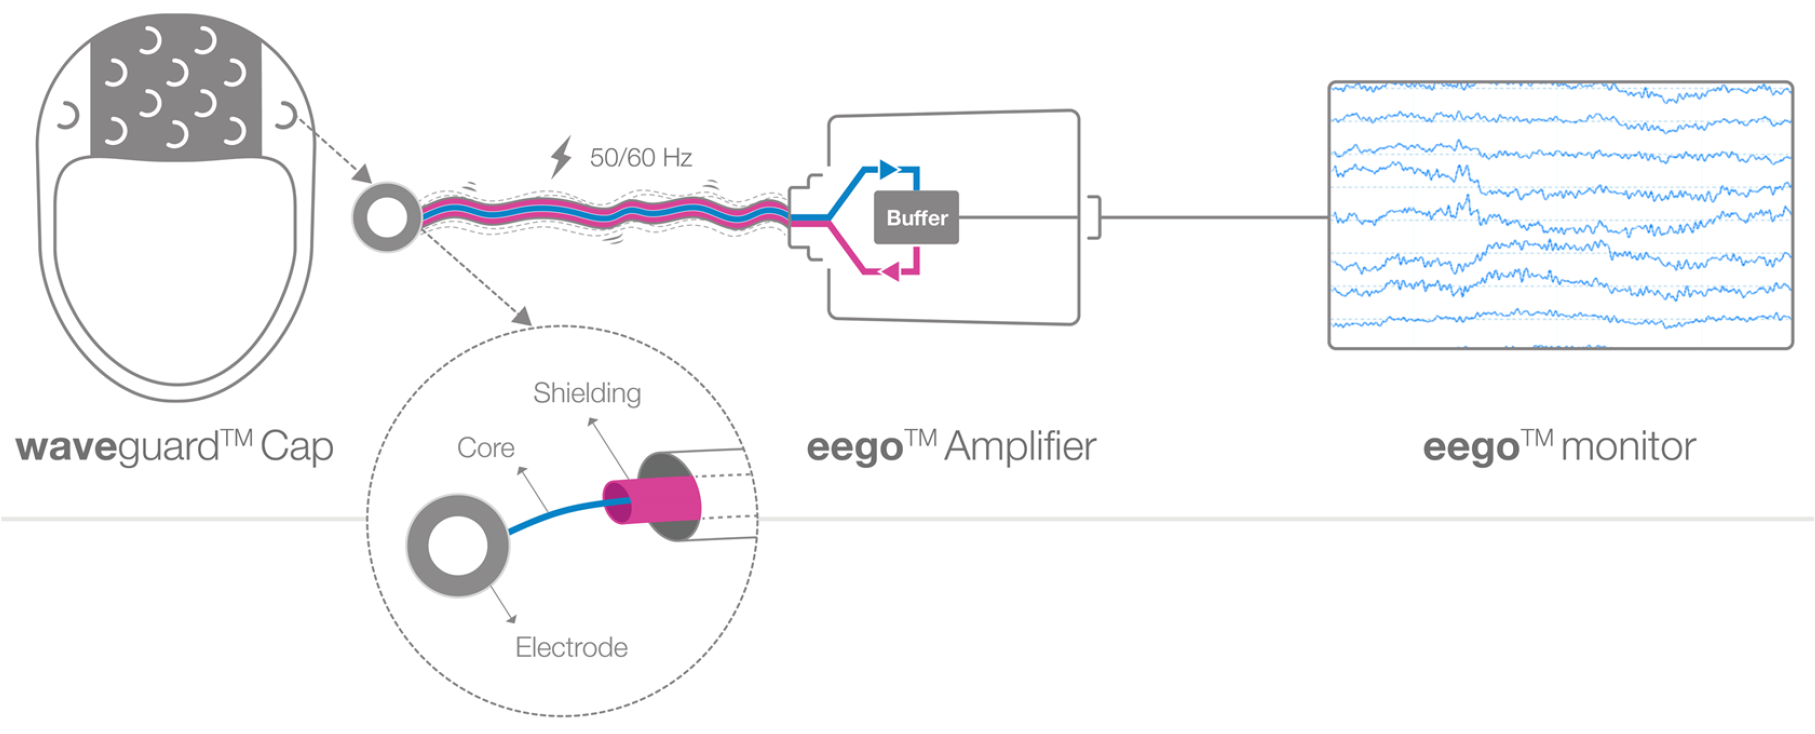
Figure 1. Functional principle of active shielding technology. EEG signal travels through a cable while being protected by the surrounding active shield. The shield receives from the buffer an amplified version of the EEG signal, which creates a zero-capacitor effect. Here core EEG cable and shield have an identical electrical pattern, therefore external electrical noise (50/60 Hz) is absorbed by the shield and does not affect EEG signal.
Active Electrodes: Active electrodes take a different approach to noise reduction. Instead of passively transmitting the weak EEG signal, each electrode pre-amplifies the brain signal right at the scalp level. This amplified signal then travels to the amplifier for further processing. The choice between going for one kind of technology vs. the other finally depends on the user requirements, while each technology has some upsides and limitations. For example, active electrodes lead to bulkier caps that may often limit subject comfort and mobility whereas actively shielded caps remain lighter to wear given the use of passive electrodes. Secondly, active electrode systems usually require longer application time and more careful handling due to exposed wires, as compared to actively shielded systems.
While both active electrodes and active shielding aim to achieve the same goal and are used by researchers and clinicians, there is no direct comparison of their performance against each other in real-world scenarios (Figure 2). This said, our results evaluate two EEG systems with active electrodes and active shielding technologies against each other by comparing the power of the physiological signal in standard experimental paradigms like resting state EEG (Outcome 1), visual evoked potentials (Outcome 2) derived from both EEG systems or impedance values (Outcome 3). We also look at impedance values for each participant to check for any differences between the two systems.
Experimental setup
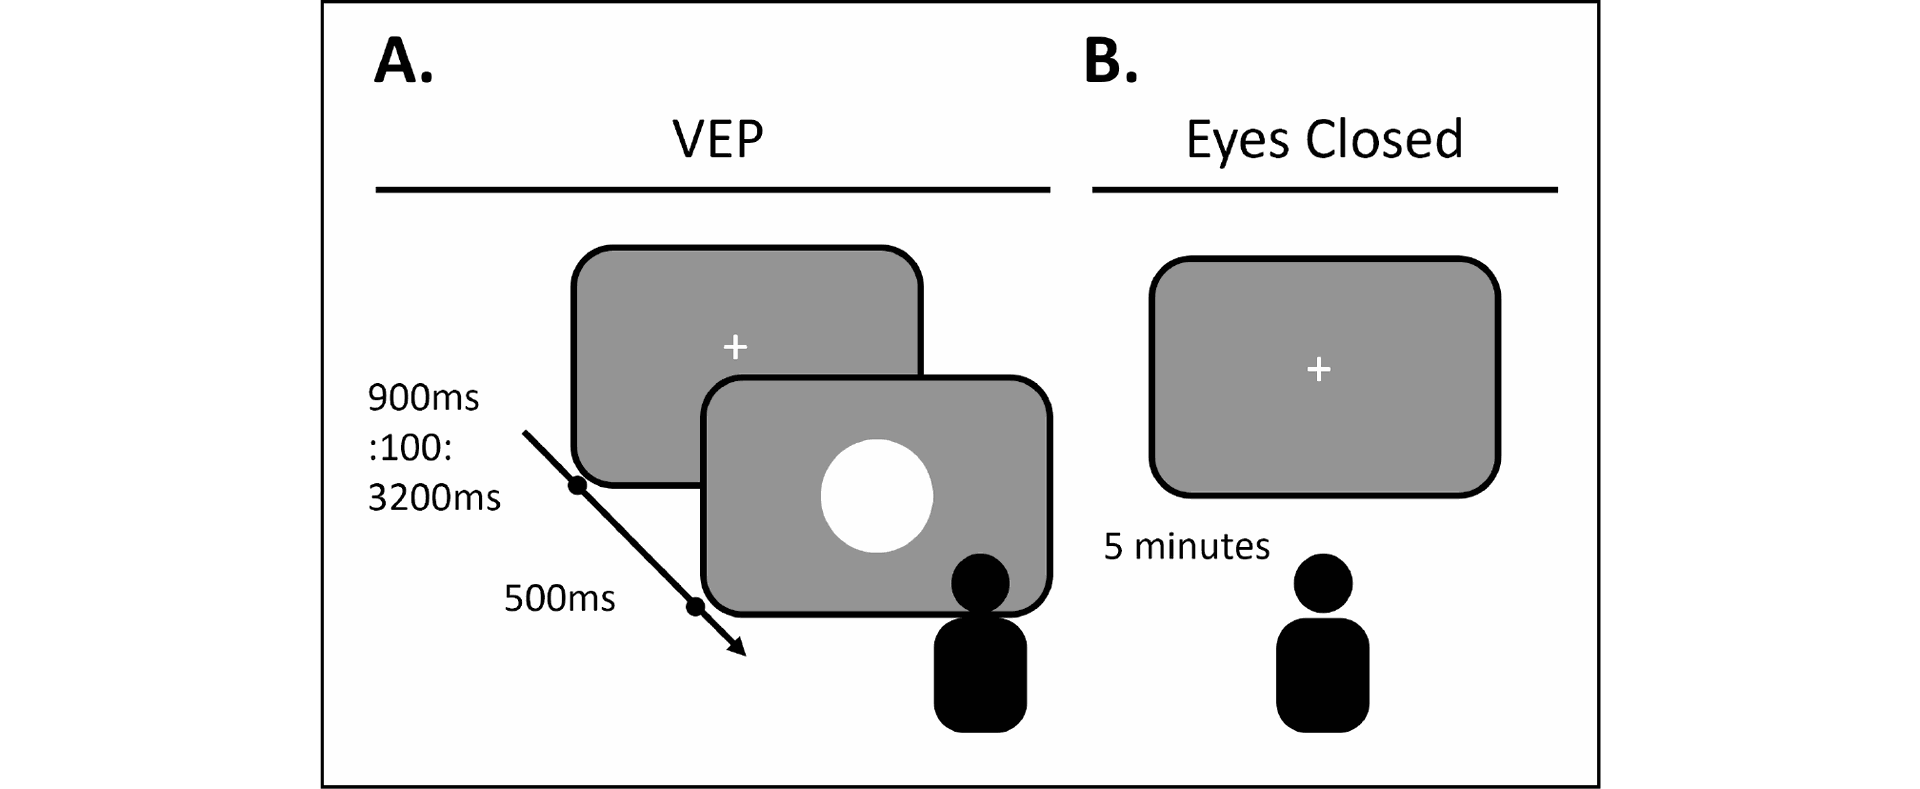
Figure 2. Schematic of experimental paradigms. Each paradigm lasted for 5 minutes. A. In the visual evoked potential (VEP) block, five participants were instructed to look at the display screen while a white circle flashed at the center of the screen (150 trials). B. In the resting state block, five participants were instructed to relax with their eyes closed.
OUTCOME 1: ALPHA BAND POWER (8hz - 12hz)
In resting-state EEG recordings, one of the most commonly studied frequency bands is the alpha band, which typically ranges from 8 to 12 Hz (Berger, 1929). Normally with eyes closed, there is an increase in alpha power, which is thought to reflect a state of relaxed wakefulness (Cantero et al., 2002). This phenomenon is commonly referred to as alpha synchronization, and it is thought to reflect a decrease in sensory input and an increase in internal processing (Klimesch, 1999). To measure alpha power, we asked participants to relax while sitting comfortably in the chair. We did 2 acquisitions each of 5 minutes where subjects were asked to first sit with eyes closed and then with open eyes. We expected that despite surrounding environmental noise, the data recorded with both EEG systems should show a distinct alpha power peak.
The averaged results (Figure 3) show a prominent Alpha peak around 8Hz – 12Hz, therefore both EEG active shielding and active electrode systems have comparable performance, irrespective of external environmental noise.
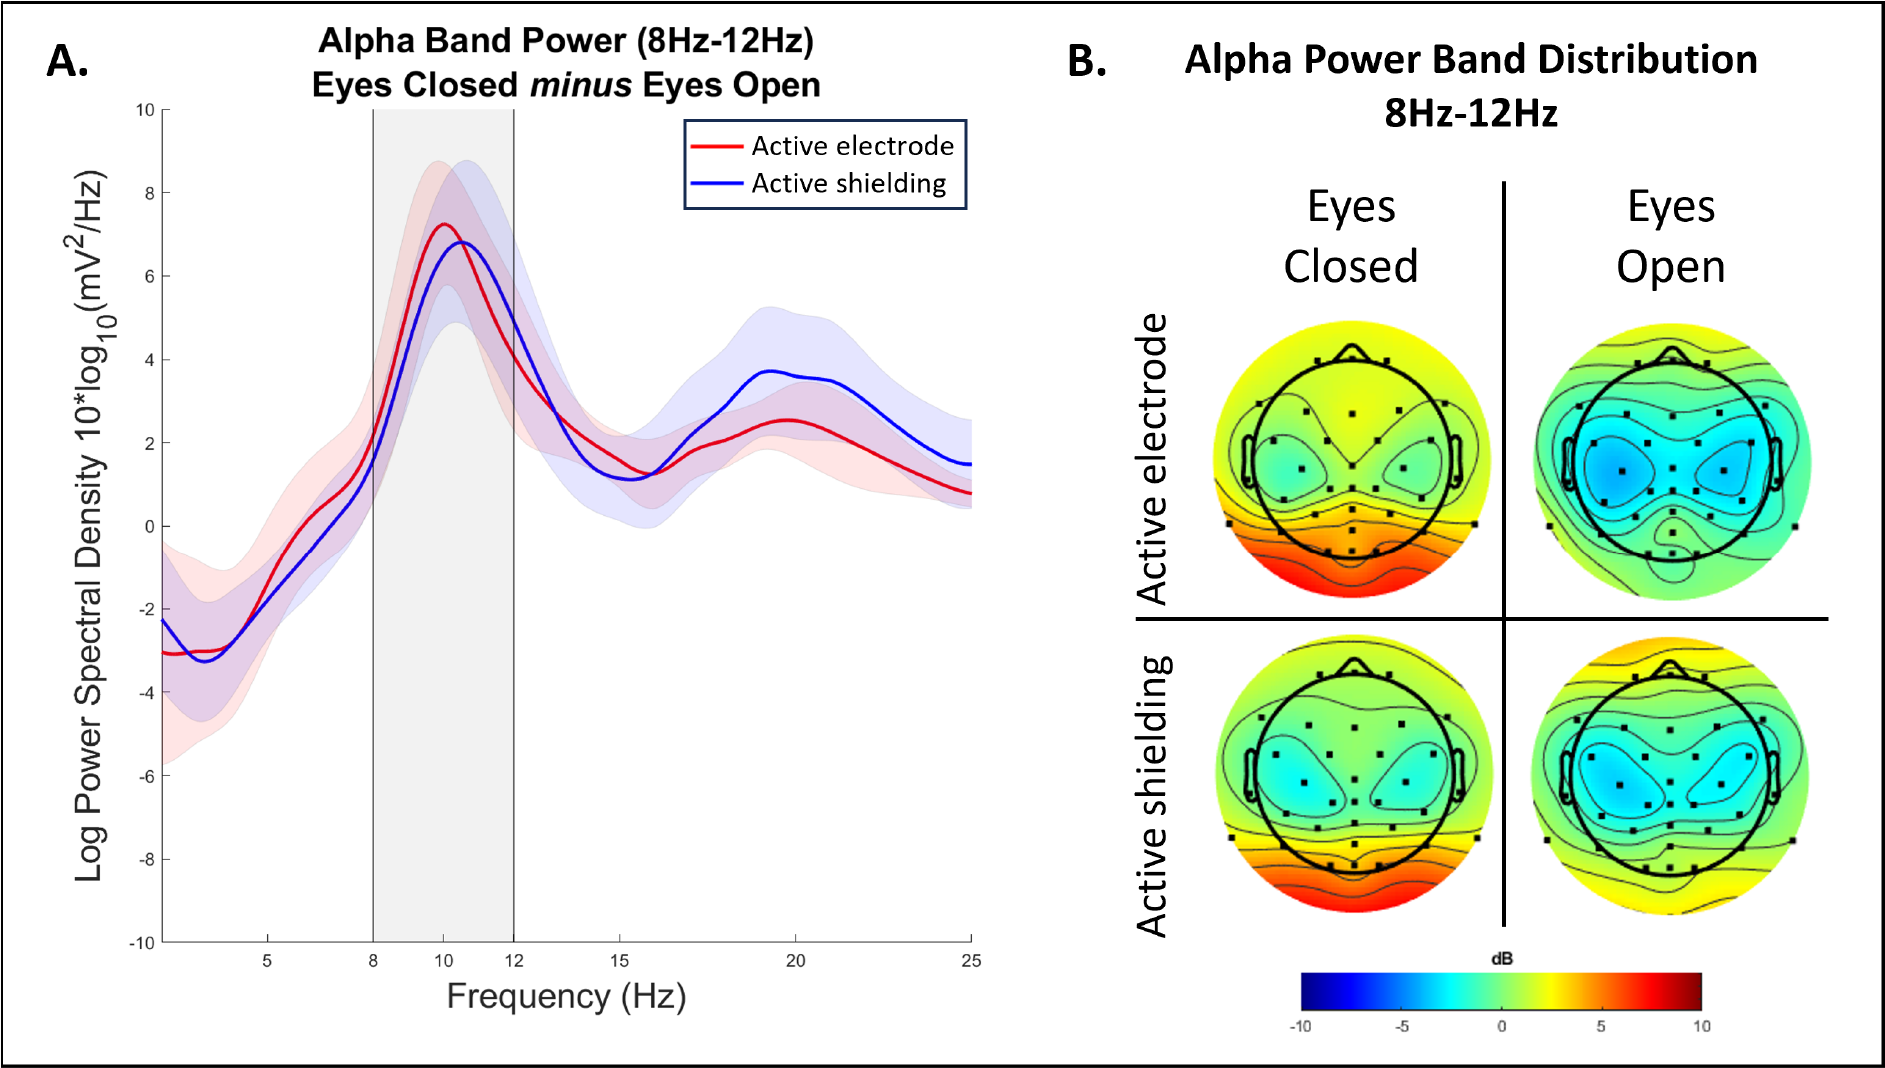
Figure 3. Alpha band power comparison between the two systems. A. Power band frequencies between 2 Hz to 25 Hz averaged across participants. B. Distribution of alpha band power (8-12 Hz) across the head separately for Eyes Closed and Eyes Open conditions for EEG systems with active electrodes and active shielding. The power of Alpha frequency and its distribution is similar across systems.
OUTCOME 2: VISUAL EVOCED POTENTIAL (VEP)
Visual evoked potential (VEP) is another paradigm that is commonly used in EEG studies (Luck, 2014). Studies with VEP paradigm commonly use visual stimulation (e.g., white flashes) on display to stimulate visual cortex which could be measured with EEG system (Slotnick et al., 1999). We focused on the early P1 peak, specifically on the peak-to-peak difference within the 80 ms -180 ms time window. Peak differences should show the detected signal strength compared to baseline brain activity. EEG systems that have a higher peak-to-peak difference should have a higher signal sensitivity as well as better noise-canceling technologies.
Both systems displayed the typical P1 pattern (Figure 4A), with no significant differences in peak-to-peak amplitudes (Figure 4B). This suggests comparable performance for both active shielding and active electrode systems in capturing VEPs, even under potential external noise. 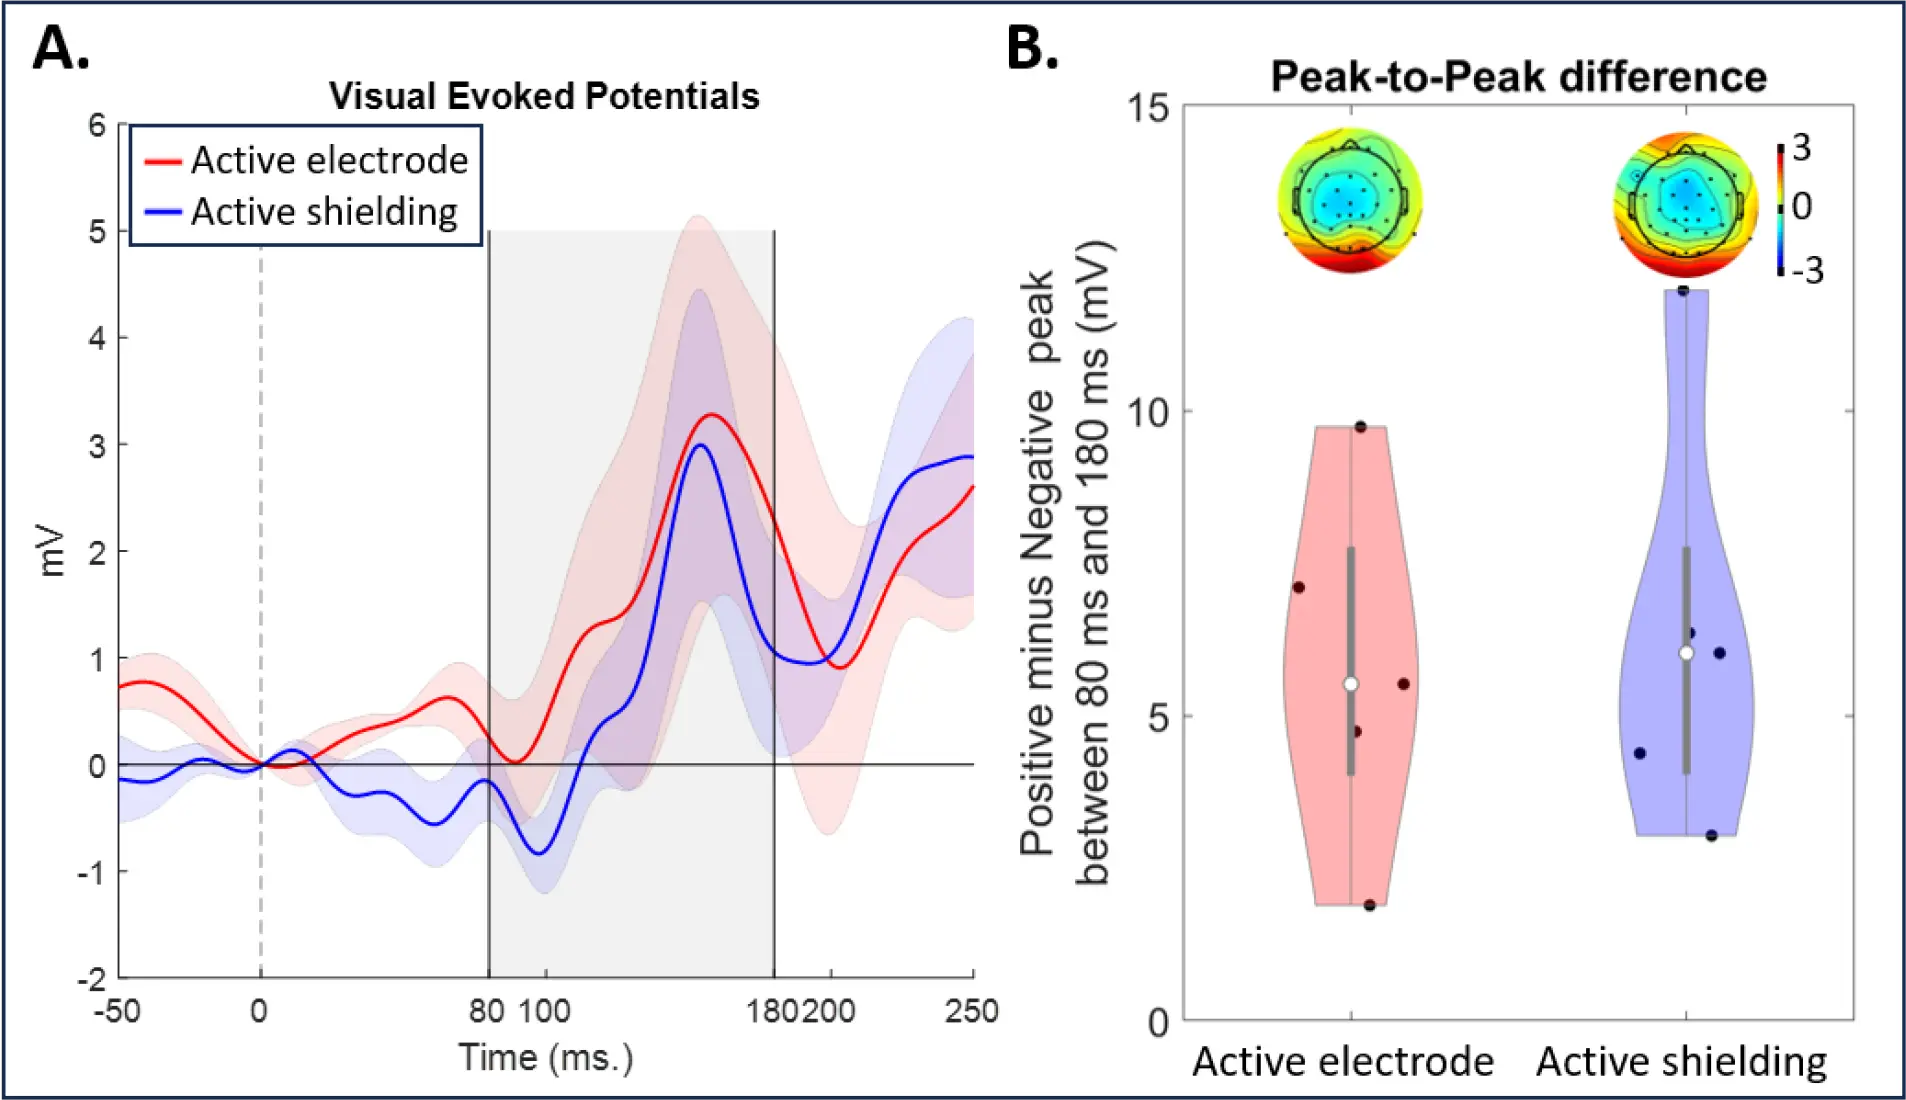
Figure 4. A comparison of the visual evoked potential acquired with active shielding and active electrode systems. A. ERP wave from the system with active shielding (blue) and active electrodes (red). B. A peak-to-peak comparison (max value minus min value; a gray window in plot A). Dots represent individual participants. Topographical maps represent average activity between 80 ms and 180 ms.
OUTCOME 3: IMPEDANCE VALUES
Impedance values often become a crucial part of EEG data quality. In the last comparison (Figure 5), we wanted to show individual impedance values for each participant when the data was reordered using active shielding and active electrode technologies.
Both systems showed impedance values below 10 Kohm and stayed under this threshold during the data acquisition. The direct comparison did not reveal any systematic advantage for either system.
Figure 5. Difference of impedance values across EEG systems with active electrode and active shielding technologies for each participant (5). The top row shows different values between systems on a topographical map. Darker red areas are areas with lower impedance values for active electrodes, and darker blue areas are areas with lower impedance values for active shielding. The bottom row shows the distribution of impedance values for each EEG system.
CONCLUSIONS
This test report demonstrates the comparability of active shielding and active electrode technology in EEG systems. This comparison is based on two experiments: resting state evaluation focused on alpha power and visual stimulation focused on visual evoked potential (VEP) power. To simulate real-world research lab conditions, we tested five participants and controlled stimulus order and environmental noise. Both EEG systems show prominent alpha power, clear VEP peaks, and impedance values under 10 kOhm. Visual inspection of the data from five participants did not reveal differences in performance between the two systems.
REFERENCES
1. Berger, H. (1929). Ueber das Elektrenkephalogramm des Menschen. [Electrocephalography in man.]. Journal Für Psychologie Und Neurologie, 40, 160–179.
2. Cantero, J. L., Atienza, M., & Salas, R. M. (2002). Human alpha oscillations in wakefulness, drowsiness period, and REM sleep: Different electroencephalographic phenomena within the alpha band. Neurophysiologie Clinique, 32(1), 54–71. https://doi.org/10.1016/S0987-7053(01)00289-1
3. Creel, D. J. (2019). Visually evoked potentials. In Handbook of Clinical Neurology (1st ed., Vol. 160). Elsevier B.V. https://doi.org/10.1016/B978-0-444-64032-1.00034-5
4. Kandel, E. R., et al. (2000). Principles of neural science. McGraw-hill.
5. Klimesch, W. (1999). EEG alpha and theta oscillations reflect cognitive and memory performance: a rKlimesch, W. (1999). EEG alpha and theta oscillations reflect cognitive and memory performance: a review and analysis. Brain Research Reviews, 29(2-3), 169–195. doi:10.1016/S016. Brain Research Reviews, 29(2–3), 169–195. https://doi.org/10.1016/S0165-0173(98)00056-3
6. Luck, S. J. (2014). An introduction to the event-related potential technique. MIT Press.
7. Parisi, V., Pierelli, F., Restuccia, R., Spadaro, M., Parisi, L., Colacino, G., & Bucci, M. G. (1998). Impaired VEP after photostress response in multiple sclerosis patients previously affected by optic neuritis. Electroencephalography and Clinical Neurophysiology/Evoked Potentials Section, 108(1), 73–79. https://doi.org/10.1016/S0168-5597(97)00063-4
8. Slotnick, S. D., Klein, S. A., Carney, T., Sutter, E., & Dastmalchi, S. (1999). Using multi-stimulus VEP source localization to obtain a retinotopic map of human primary visual cortex. Clinical Neurophysiology, 110(10), 1793–1800. https://doi.org/10.1016/S1388-2457(99)00135-2
DISCLAIMER
All information provided in this document is intended as a summary only.
For detailed product related information please always consult the latest version of the respective product’s user manual. This document is not intended to replace the user documentation. For indications on individual feature certification status (clinical vs. research only) please refer to the aforementioned user documentation.
We have attempted to write this document as accurately as possible. However, mistakes are bound to occur, and we reserve the right to make changes whenever needed or whenever new information becomes available.
All product names and brand names in this document are trademarks or registered trademarks of their respective holders.
© Copyright 2025 eemagine Medical Imaging Solutions GmbH.
No part of this document may be photocopied or reproduced or transmitted in any way without prior written consent from eemagine Medical Imaging Solutions GmbH.