This Application Note provides setup guidance for multimodal recordings using bipolar sensors like EMG, ECG, and EOG. It outlines hardware requirements, including the use of a sensebox or bipolar box, and explains the corresponding electrode cable connections. Software configuration recommendations and best practices are included to ensure accurate data acquisition.
OBJECTIVES
This Application Note aims to provide guidance on how to configure a multimodal recording set-up for the use of bipolar sensor. The document includes a detailed overview of the most commonly used bipolar sensors: EMG, ECG, EOG. For each bipolar sensor, the document outlines its technical specifications, including key features such as sensitivity, range, and data acquisition parameters. In addition, examples of typical use cases will be provided, highlighting the scenarios where each sensor proves most beneficial. This application note also offers best practices for proper electrode setup, ensuring accurate and reliable data collection.
HARDWARE CONNECTIONS
Bipolar channels can be accessed through a dedicated unit attached to the bipolar port of the eego™ amplifier: this can be a sensebox (for combined use with AUX channels) or a bipolar box (for BIP channels only). The type of electrode cable to be used depends on the unit:
- 4-pin binder (XE-126): When using a sensebox, adapter cable XE-126 can be connected to one of the two 4-pin binder BIP ports (channels 1-2). This cable provides access to a pair of shielded flat-snap sensor cables (integrated positive and negative lead).
- Touch-proof (XS-125): When a bipolar box is being used, each pair of connectors (positive and negative lead) can be accessed using 2 flat snap touch-proof electrodes XS-125.
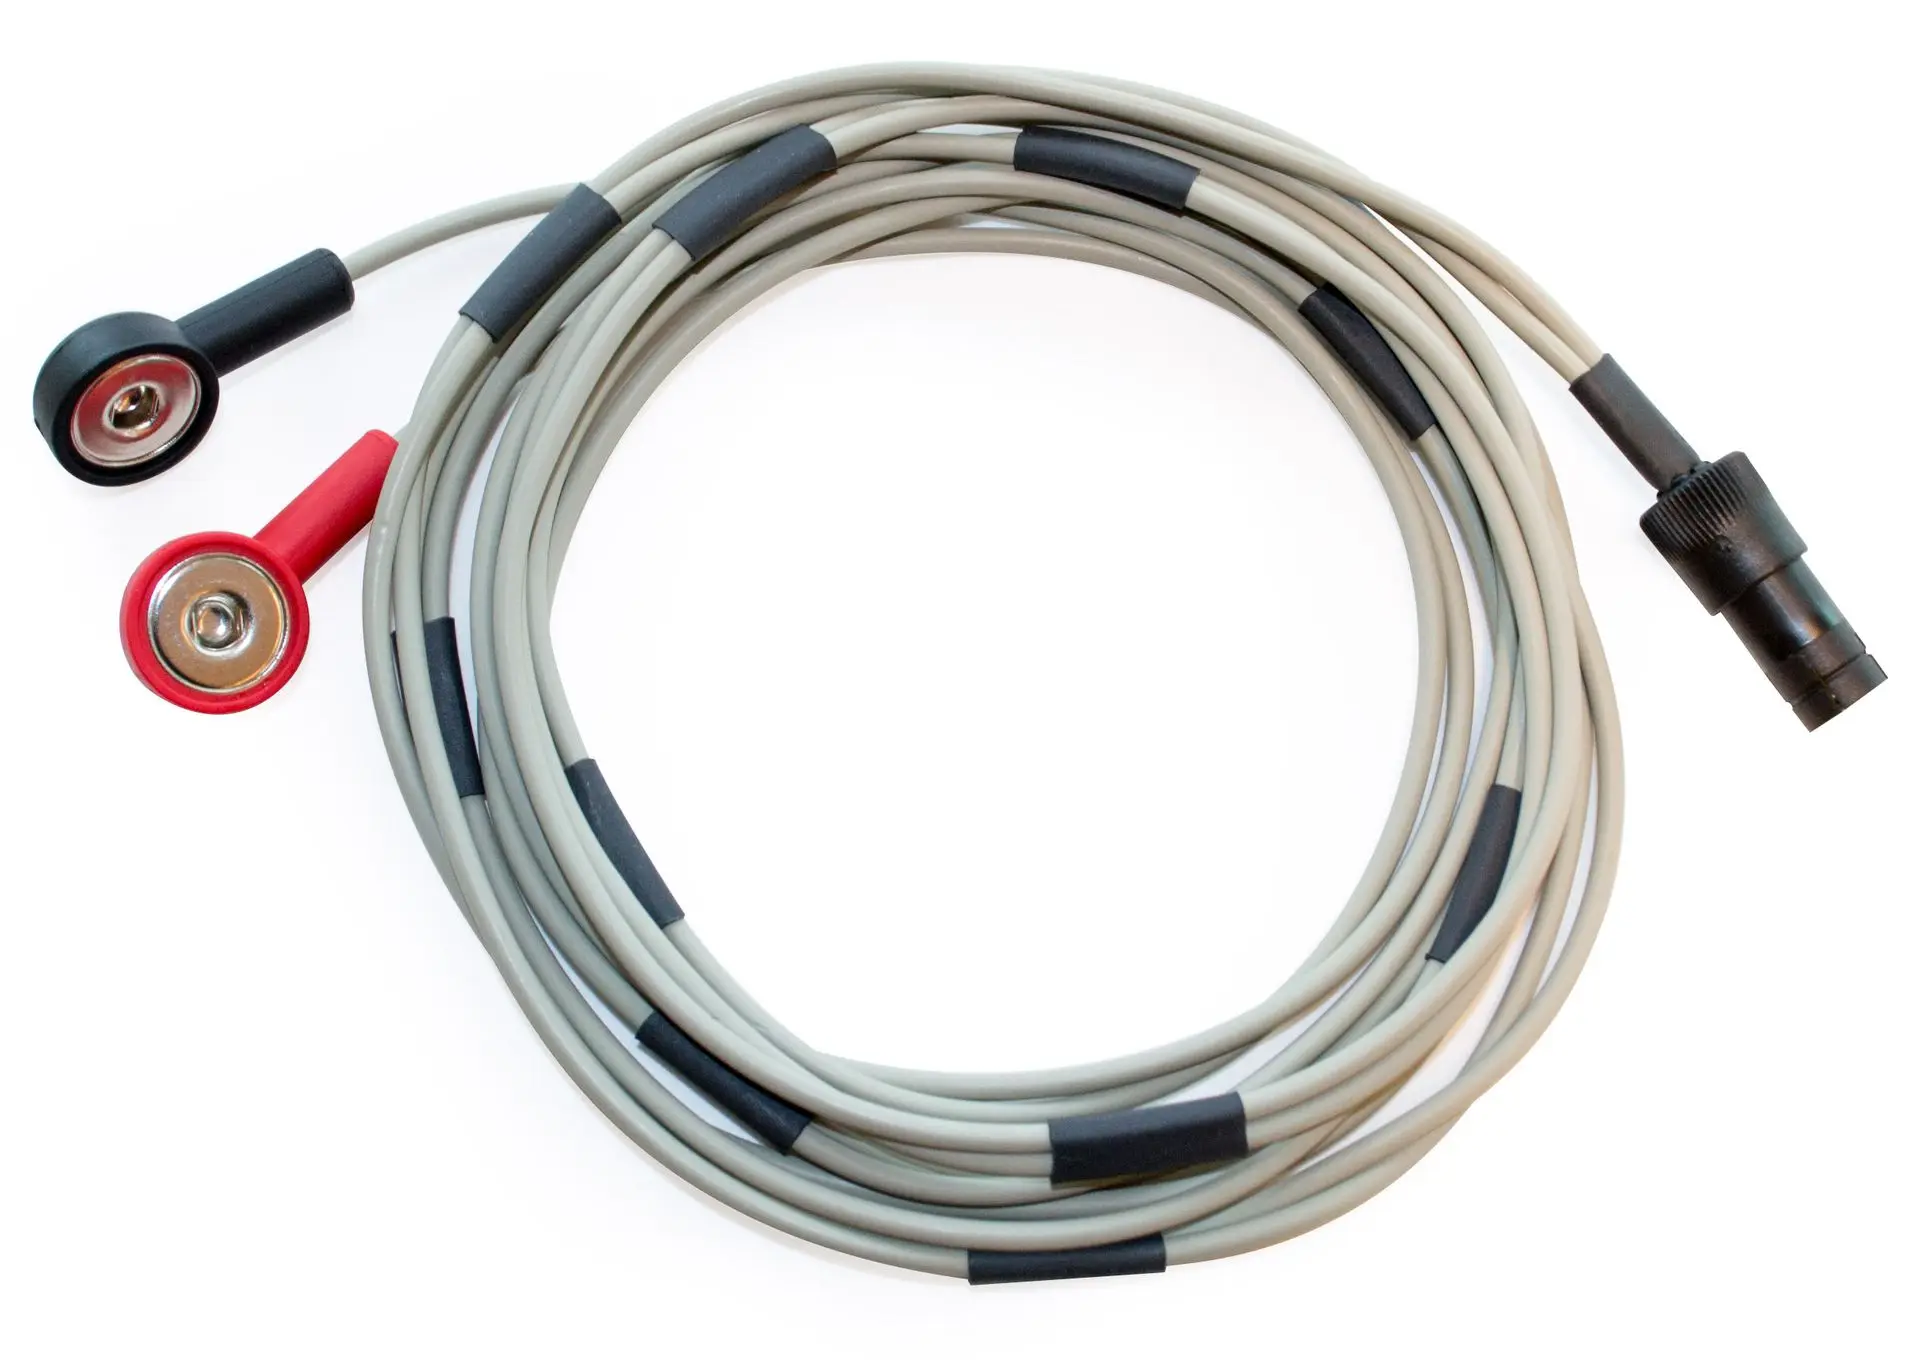 XE - 126
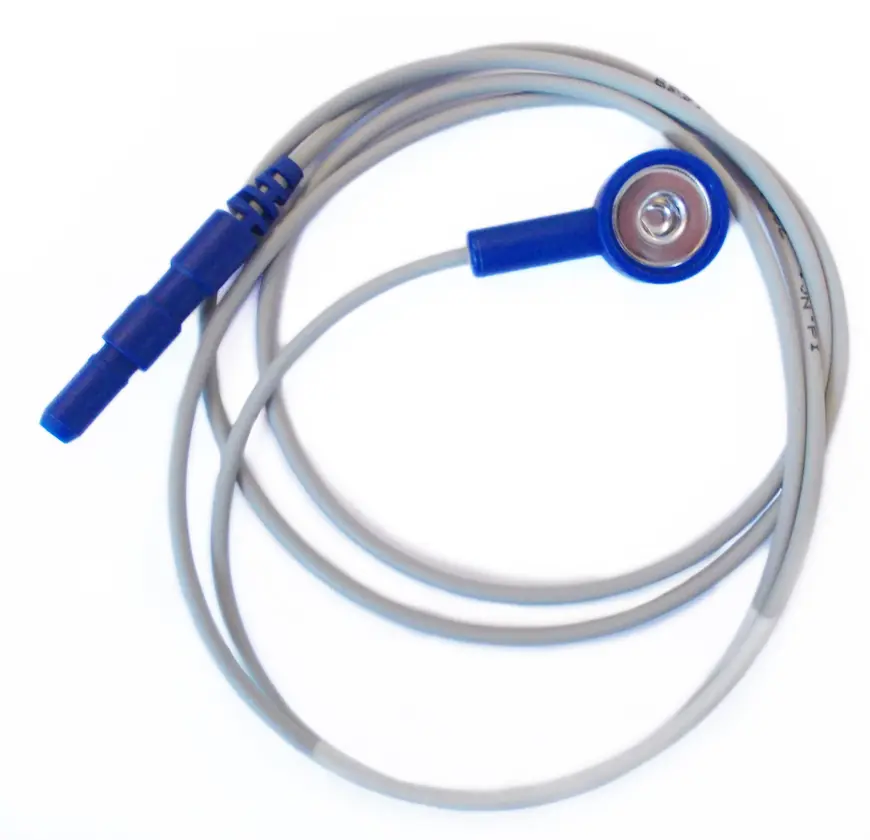 XE - 125
SOFTWARE CONFIGURATION
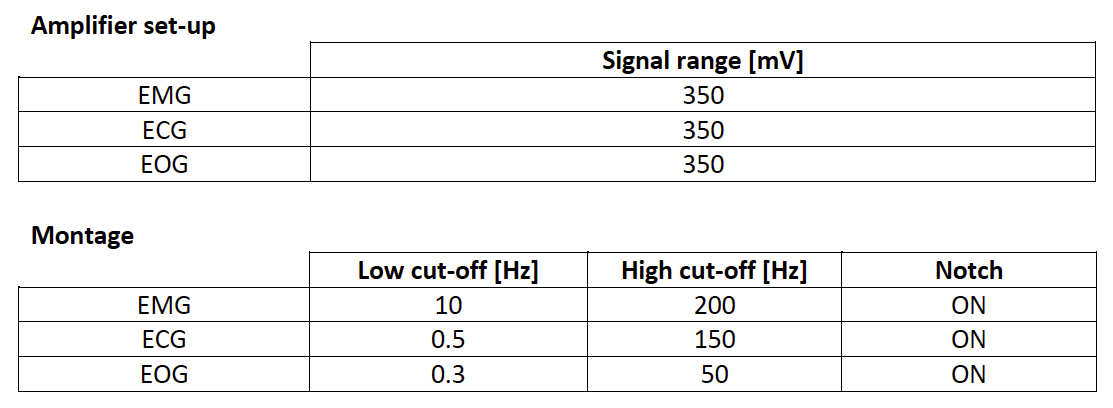
The tables below provide some recommended values for each of the bipolar sensors discussed in this document, to be used during the configuration of the experimental set-up in eego™ software. In the amplifier set-up, the signal range (amplifier gain) can be defined to prevent the saturation of the traces in case of high amplitude signals. The montage allows for the customization of visualization parameters such as bandpass and notch filter, as well as trace colors. For more details on the definition of amplifier set-up and montage, please consult the Application Note: Sensors for eego, pt.1 – Hardware and software configuration.
EMG
Electromyography (EMG) sensors are widely used in both clinical and research settings to measure the electrical activity produced by skeletal muscles during contraction and relaxation. This data provides valuable insights into neuromuscular function, enabling the assessment of muscle performance, coordination, and fatigue, as well as the diagnosis of neuromuscular disorders. When integrated into multimodal systems like EEG, EMG sensors contribute to a comprehensive understanding of the body’s physiological responses by linking brain activity with muscular activity. This combination opens new avenues for research in motor control, neurorehabilitation, and human-machine interactions.
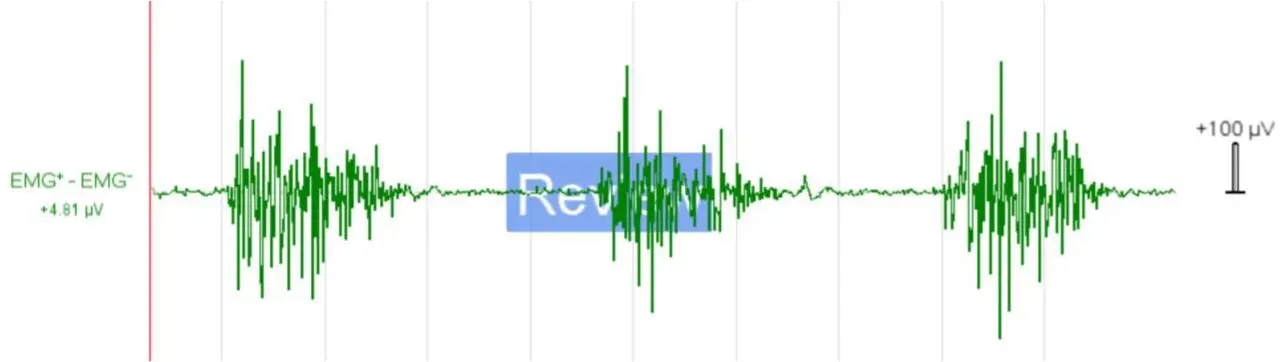
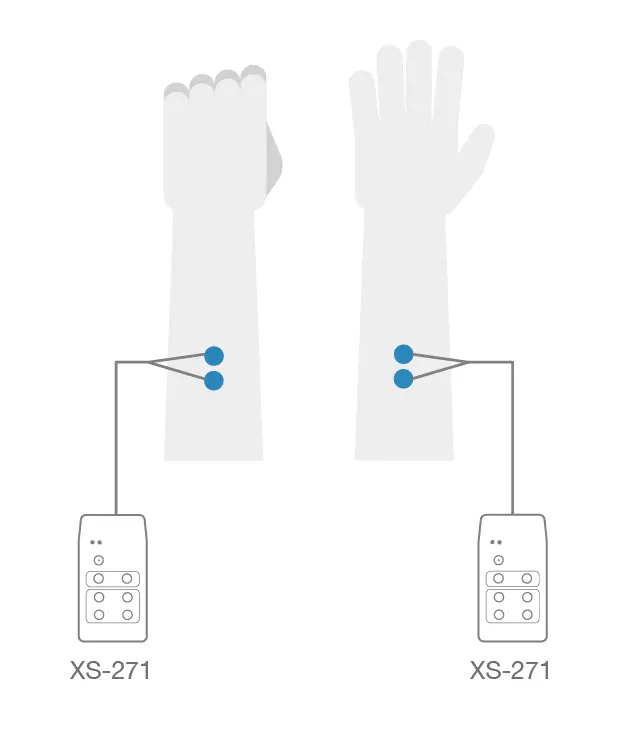
Figure 2 - Example of raw surface EMG data (top panel) collected from the extensor muscle of the forearm during a continuous motion of clenching and unclenching of the fist (bottom panel). Ground is placed on the bony part of the elbow. Higher spikes of activation (clenching) alternate with lower levels of baseline activity (unclenching). Visualization filters: bandpass [10-200]Hz, notch 50Hz .
Characteristics of the EMG Signal
EMG measures the electrical potential generated when motor neurons activate muscle fibers. These signals typically range in amplitude between ~0-10 mV and require amplification for accurate recording and analysis. EMG signals are characterized by their frequency (typically between 10 Hz and 500 Hz) and amplitude, both of which depend on the size and speed of muscle contractions, as well as the number of motor units recruited during movement. The signal is inherently noisy, primarily due to the complexity of muscle firing patterns, but proper electrode placement and signal processing techniques can optimize data quality.
Benefits and Applications of Combined EEG-EMG Recordings
Combining EEG with EMG in multimodal recording provides a more comprehensive view of the relationship between neural activity and muscle function. This integration is particularly beneficial for studying motor control and coordination, offering the ability to map out how brain signals translate into muscle movements.
Some examples of possible applications include:
- Neurorehabilitation: Monitoring brain and muscle activity in real-time to assess recovery progress in stroke or spinal cord injury patients, guiding personalized rehabilitation protocols.
- Movement disorders: Diagnosing and researching conditions like Parkinson’s disease, dystonia, or tremors by correlating abnormal brain rhythms with muscle spasms or involuntary movements.
- Biomechanics and Ergonomics: Investigating muscle fatigue, motor performance, and efficiency during physical tasks, aiding in injury prevention and optimizing athletic performance.
- Brain-computer interfaces (BCI): Enabling control of external devices through thought and muscle signals, providing new solutions for prosthetics or assistive technologies for people with disabilities.
Electrode Placement and Best Practices for EMG Signal Quality
To achieve optimal signal quality in EMG recordings, correct placement and preparation of the electrodes are crucial. Here are some guidelines:
- Electrode Placement: Electrodes should be placed directly over the muscle belly (the thickest part of the muscle), avoiding tendon areas and neighboring muscles to reduce crosstalk (signals from adjacent muscles). For example, in the forearm, place the electrodes on the bulk of the flexor or extensor muscles rather than near the wrist where tendons dominate. The two electrodes used in a bipolar configuration should be placed approximately 2cm apart along the muscle’s length - following the muscle fibers’ direction- to measure the differential electrical potential across the muscle tissue. The European SENIAM organization provides useful guidelines to identify the optimal electrode placement for different muscle groups [http://seniam.org/sensor_location.htm].
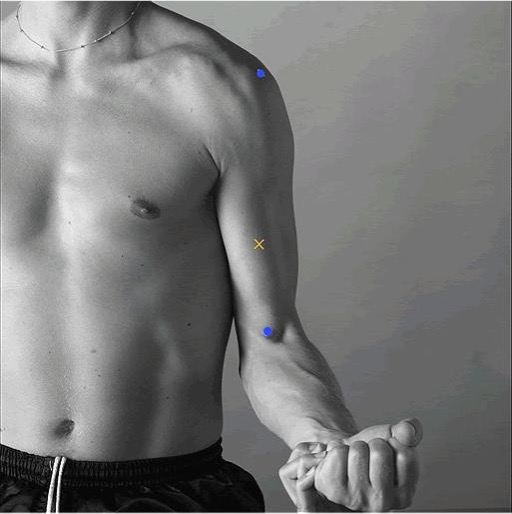
Figure 3 - Example of how to identify the placement location and orientation of electrodes to measure the electrical activity of the Biceps brachii muscle, based on the SENIAM recommendations. The X marks the location where to attach the electrodes, a couple of cm apart from each other, in the direction indicated by the anatomical landmarks highlighted with blue dots (at 1/3 of the line between the fossa cubit and the acromion). [Source: http://www.seniam.org/]
- Skin Preparation: Skin must be properly cleaned to reduce impedance and improve signal quality. Shave any excess hair and clean the skin with alcohol wipes to remove oils, sweat, and dead skin cells.
- Ground Electrode: The patient ground is normally supplied by the EEG system. If the EMG signal is being recorded separately and requires an independent ground electrode, this should be placed on a bony, electrically neutral area (e.g., the elbow or wrist) to provide a stable baseline and reduce noise in the signal.
- Minimizing Movement Artifacts: Ensure that electrode wires are secured and do not move during muscle contraction or physical activity, as movement artifacts can distort the signal. Use adhesive tapes or bands to hold the cables in place.
- Visualization parameters: Typical filter values for optimal online visualization of EMG signal are [10-200]Hz, which could slightly vary depending on the examined muscle. 50Hz notch filter can also be applied if the experimental environment requires it.
By following these guidelines, researchers and clinicians can ensure high-quality EMG data that, when combined with EEG, provides invaluable insights into the brain-muscle connection and enhances the scope of multimodal research and diagnostics.
ECG
Electrocardiography (ECG) sensors are a fundamental tool in both clinical and research settings for monitoring the electrical activity of the heart. ECG provides a real-time recording of the heart’s electrical conduction system, reflecting the rhythm, rate, and specific characteristics of the heart’s cycles. It is essential for diagnosing a wide range of cardiovascular conditions, including arrhythmias, ischemia, and other heart abnormalities. When combined with EEG in multimodal recordings, ECG offers valuable insights into the autonomic nervous system’s interactions with the brain, particularly in contexts like stress research, sleep studies, and neurocardiovascular investigations.
Characteristics of the ECG Signal
ECG signals represent the electrical activity of the heart as it contracts and relaxes during the cardiac cycle. These signals are generated by depolarization and repolarization of the atria and ventricles, producing a waveform typically consisting of the P-wave, QRS complex, and T-wave. The frequency range of ECG signals is relatively low, with significant components between 0.05 Hz and 100 Hz, while their amplitude typically ranges from 0.1 mV to 5 mV.
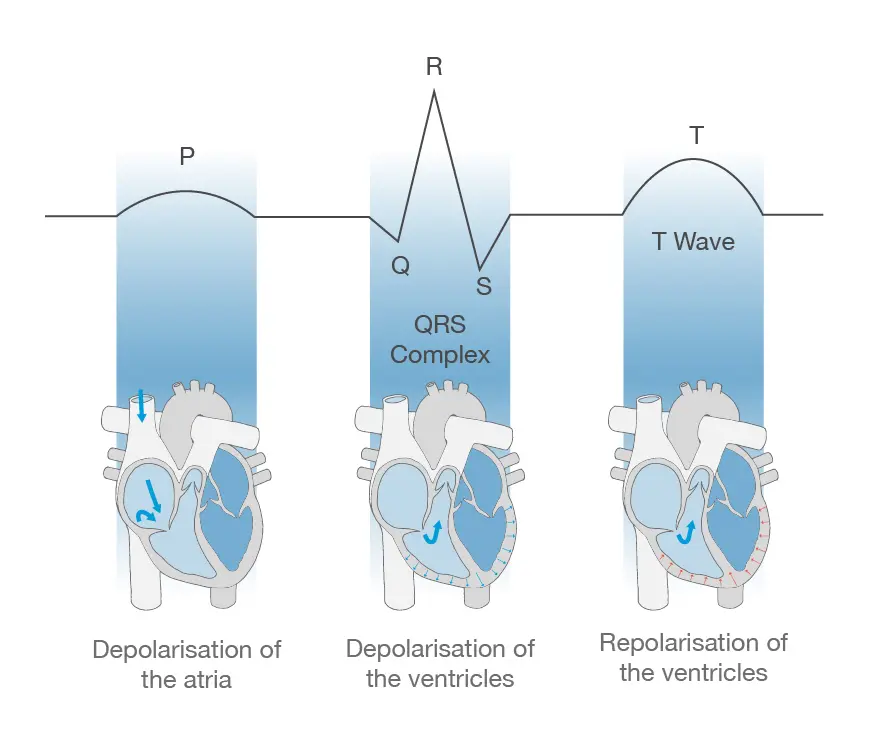
Figure 4 -The electrical pulse travelling through the cardiac tissues induces sequential phases of polarization and depolarization of the atria and ventricles. This results in the characteristic EMG components: p-wave, QRS complex and T wave.
The ECG signal is important for understanding heart rate variability (HRV), arrhythmias, and other indicators of cardiovascular health. The ability to track these signals simultaneously with EEG enables researchers to study the brain-heart connection, offering a better understanding of how emotional, mental, and physical states affect cardiac function.
Benefits and Applications of Combined EEG-ECG Recordings
The integration of ECG with EEG in multimodal systems opens up a range of research and clinical possibilities, enabling simultaneous monitoring of the central nervous system (CNS) and cardiovascular system. This combination is particularly useful in understanding the influence of neural activity on heart function and vice versa.
Some examples of applications include:
- Autonomic Nervous System Research: EEG-ECG recordings allow for the analysis of how brain activity affects heart rate and vice versa, offering insights into autonomic functions like stress responses, relaxation, or emotional regulation.
- Sleep Studies: By monitoring brain waves and heart activity during sleep, EEG-ECG integration helps to assess sleep quality, detect disorders like sleep apnea, and understand the relationship between sleep stages and heart rate.
- Stress and Emotional Research: Correlating heart rate variability (HRV) with EEG data provides a clearer picture of how stress, anxiety, and other emotional states impact cardiovascular health and brain activity.
- Neurocardiology: Combined EEG-ECG data is valuable for investigating conditions like vasovagal syncope, where changes in brain activity can trigger abnormal heart rhythms, helping to understand neural origins of cardiovascular conditions.
Benefits and Applications of Combined EEG-ECG Recordings
Electrode Placement and Best Practices for ECG Signal Quality Accurate ECG signal acquisition depends on the correct placement of electrodes and careful preparation to minimize noise and artifacts. Below are some best practices for ECG electrode placement and signal optimization:
- Standard Electrode Placement: For typical recordings, a three-electrode configuration is often used: two active electrodes placed on the chest or upper limbs (such as below the clavicles or on the wrists), and one reference electrode (ground) placed on a bony area like the sternum or ankle. In some cases, a more extensive 12-lead setup may be used for detailed clinical assessments.
- Bipolar Configuration: In a basic ECG configuration, the signal is recorded as the difference in electrical potential between two points, typically across the chest or limbs. For example, electrodes can be placed right below each clavicle or on the right arm and left leg, which is often used for clearer heart rhythm tracking.
- Skin Preparation: Proper skin preparation is essential to reduce skin-electrode impedance and ensure clear signal acquisition. Shaving body hair (if necessary) and cleaning the skin with alcohol to remove oils and debris will help achieve better electrode adhesion and reduce signal noise.
- Minimizing Artifacts: To avoid movement artifacts, secure the electrode cables and ensure the subject is in a stable position during the recording. Artifacts from respiration or muscle movements can interfere with the ECG signal, so maintaining a calm, steady posture is critical, particularly in prolonged recordings.
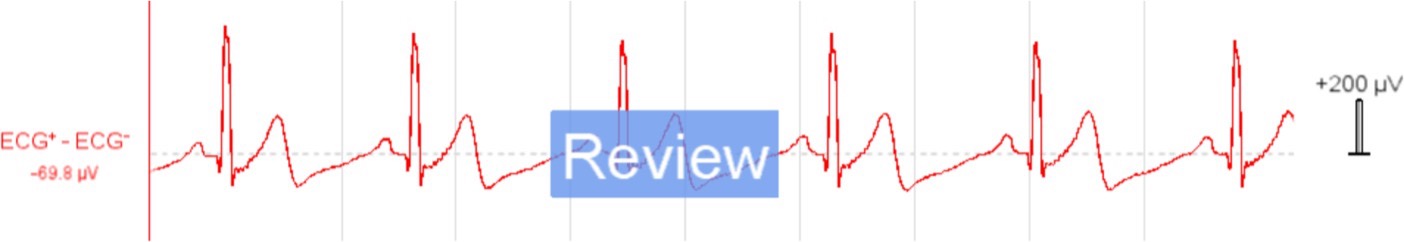
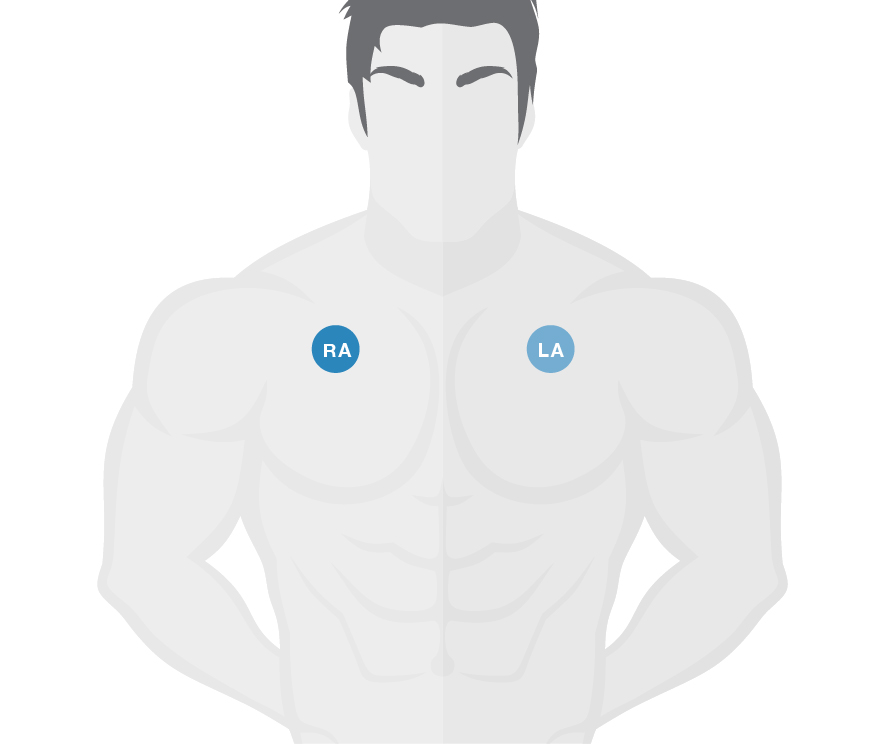
Figure 5 – Example of a typical ECG recording (top panel), obtained with a bipolar electrode configuration, where two electrodes are placed on opposite sides of the chest, right below the clavicles (bottom panel). Visualization filters: bandpass [0.5-150]Hz, notch 50Hz
- Ground Electrode Placement: In a multimodal recording, the patient ground is normally supplied by the EEG system. If the ECG signal is being recorded separately and requires an independent ground electrode, this should be placed on an electrically neutral area, such as the sternum or ankle, to provide a stable baseline, helping to reduce common-mode noise and improving the overall signal-to-noise ratio.
- Visualization parameters: Typical filter values for optimal online visualization of ECG signal are [0.5-150]Hz. 50Hz notch filter can also be applied if the experimental environment requires it.
EOG
Electrooculography (EOG) sensors are widely used to measure eye movement by detecting the electrical potential difference between the front (cornea) and back (retina) of the eye. The eye acts as a dipole, where the cornea is more positively charged relative to the retina. EOG provides a non-invasive method for tracking eye movement, which is valuable for studying visual attention, gaze behavior, and sleep stages, as well as for diagnosing oculomotor disorders. When integrated with EEG systems, EOG offers insights into how eye movement correlates with brain activity, making it particularly useful in research involving visual processing, sleep, and cognitive workload assessments.
Characteristics of the EOG signal
EOG measures the potential difference generated by the movement of the eye, this results in a signal typically between 10 µV and 100 µV. These signals are mostly recorded in a bipolar configuration, using pairs of electrodes placed around the eyes—either horizontally (for tracking left-right movement) or vertically (for up-down movement). EOG signals operate within a frequency range from 0.1 Hz to 10 Hz. Unlike EEG or EMG, EOG does not measure electrical activity generated directly by the muscles or nerves but instead captures the eye's electrical dipole as it moves in response to visual stimuli.
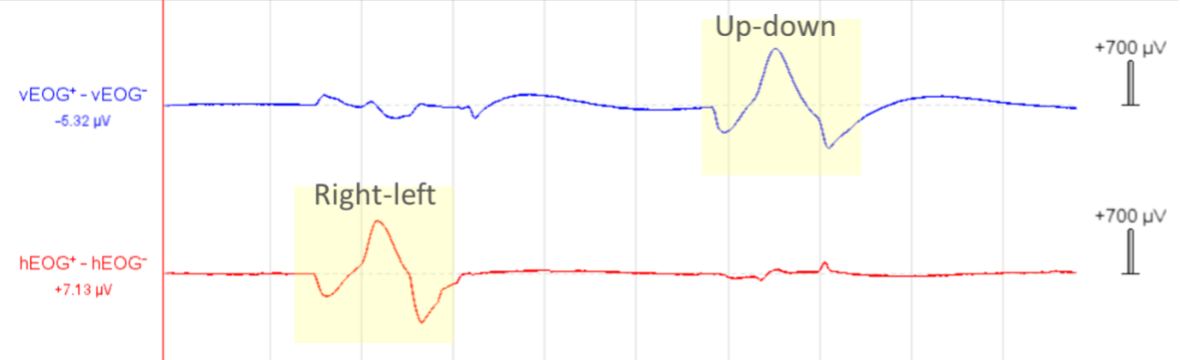
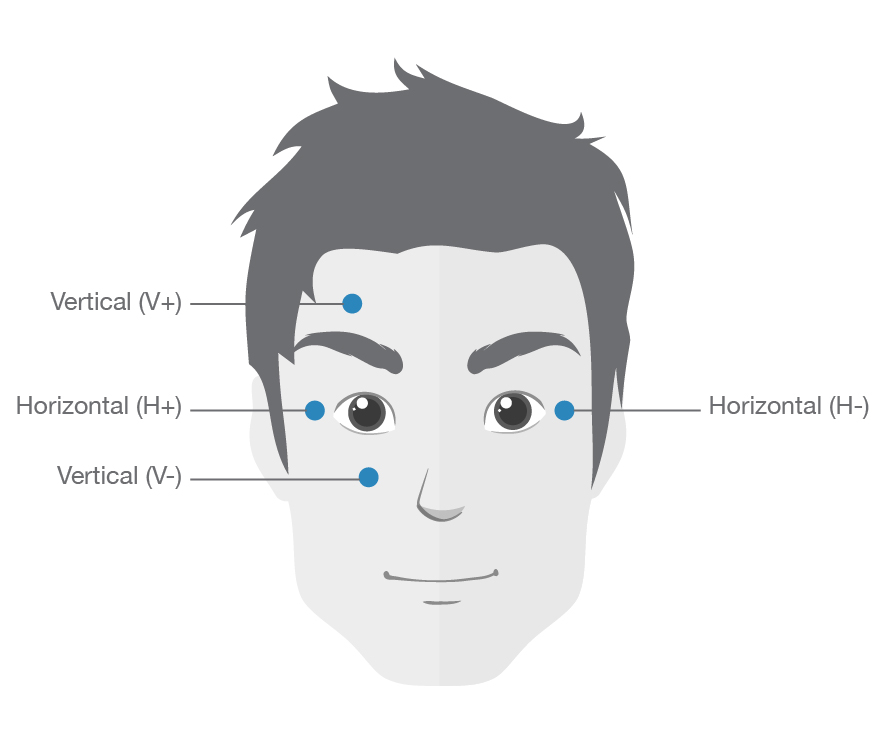
Figure 6 – Example of vertical and horizontal EOG signal (top panel, vEOG and hEOG respectively), recorded using two bipolar channels placed as depicted (bottom panel). In highlight, is possible to distinguish the waveform generated by the up-down and right-left movement of the eyes (in the vEOG and hEOG trace, respectively). Visualization filters: bandpass [0.3-50]Hz, notch 50Hz
Because eye movements often create artifacts in EEG recordings, capturing EOG signals alongside EEG is crucial for artifact correction and better interpretation of neural data, especially when studying visual tasks or cognitive functions related to eye movement. This is especially useful in the case of eye blink artefacts, which are captured by EOG despite not being related to eye movement but rather to the contraction of the eyelid muscles during blinking. Having a dedicated bipolar channel to detect this type of artefact can facilitate the pre-processing of EEG data (e.g by performing a regression of the blink artefact from the EEG traces).
Benefits and Applications of Combined EEG-EOG Recordings
The integration of EOG with EEG provides a robust way to study the relationship between eye movement and brain activity. This multimodal approach is particularly beneficial in areas such as visual attention research, sleep studies, and cognitive workload assessments.
Some key applications include:
- Visual Attention and Cognitive Workload: EEG-EOG recordings are used to monitor brain activity in conjunction with eye movements during tasks that require visual attention. This is valuable in studying user experience, interface design, or cognitive load in various environments, such as during driving or using virtual reality systems.
- Sleep Research: EOG is essential in sleep studies to identify rapid eye movement (REM) sleep, a critical phase for dreams. Combining EEG and EOG helps distinguish between different sleep stages and better understand sleep architecture.
- Oculomotor Disorder Diagnosis: EEG-EOG recordings can help diagnose disorders such as strabismus, nystagmus, or saccadic eye movement abnormalities by correlating abnormal eye movements with brain wave patterns.
- Human-Computer Interaction (HCI): EOG signals can be used to track eye movement in real-time, providing valuable data for eye-tracking interfaces or gaze-based control systems. Combining EEG and EOG allows for the study of brain responses while using these systems.
Electrode Placement and Best Practices for EOG Signal Quality
To ensure the best quality EOG signal and effective integration with EEG recordings, proper electrode placement and preparation are essential. Below are some guidelines and best practices for recording EOG signals:
- Horizontal and Vertical Placement: For horizontal eye movements, place two electrodes on the outer canthi (the outer corners of each eye). For vertical movements, place one electrode above and one below the eye. This placement ensures that changes in electrical potential due to eye movement are accurately captured.
- Ground Electrode: A reference or ground electrode is typically placed on the forehead or mastoid bone to provide a stable baseline and reduce signal noise. This helps improve the quality of the differential signal recorded from the electrodes placed around the eyes.
- Skin Preparation: Proper skin preparation is essential to reduce impedance. The skin around the eyes should be cleaned with alcohol wipes to remove oils and debris, and any excessive hair should be shaved if necessary. This preparation helps ensure better electrode adhesion and reduces noise in the EOG signal.
- Minimizing Artifacts: While EOG signals themselves are used to measure eye movements, careful placement and attention to movement artifacts are necessary when integrating with EEG. Movements such as blinking or excessive facial muscle activity can introduce noise, so it is important to minimize unnecessary facial movements during the recording session.
- Signal Interpretation: Since EOG signals are often considered noise in EEG recordings, it's important to correctly identify and use EOG data for artifact correction. This ensures that brain activity related to visual processing or cognitive workload is isolated and properly analyzed.
By following these best practices for electrode placement and signal optimization, researchers can ensure high-quality EOG recordings. When combined with EEG, EOG provides a powerful tool for studying the interaction between eye movement and brain activity, expanding the scope of research in visual processing, cognitive load assessment, and sleep analysis.
DISCLAIMER
All information provided in this document is intended as a summary only.
For detailed product related information please always consult the latest version of the respective product’s user manual. This document is not intended to replace the user documentation. For indications on individual feature certification status (clinical vs. research only) please refer to the aforementioned user documentation.
We have attempted to write this document as accurately as possible. However, mistakes are bound to occur, and we reserve the right to make changes whenever needed or whenever new information becomes available.
All product names and brand names in this document are trademarks or registered trademarks of their respective holders.
© Copyright 2025 eemagine Medical Imaging Solutions GmbH.
No part of this document may be photocopied or reproduced or transmitted in any way without prior written consent from eemagine Medical Imaging Solutions GmbH.