This Application Note provides comprehensive guidance on configuring multimodal EEG recordings using bipolar and auxiliary sensors, including EMG, ECG, EOG, respiration, temperature, GSR, and accelerometers. It outlines hardware/software setup with the Sensebox XS-271 and eego™ amplifier, sensor specifications, and best practices for placement and calibration. Emphasis is placed on integrating these sensors with EEG to enhance analysis of brain-body interactions in stress, sleep, emotion, cognition, and clinical research.
OBJECTIVES
This Application Note aims to provide guidance on how to configure a multimodal recording set-up for the use of bipolar sensor. The document includes a detailed overview of the most commonly used bipolar sensors: EMG, ECG, EOG. For each bipolar sensor, the document outlines its technical specifications, including key features such as sensitivity, range, and data acquisition parameters. In addition, examples of typical use cases will be provided, highlighting the scenarios where each sensor proves most beneficial. This application note also offers best practices for proper electrode setup, ensuring accurate and reliable data collection.
HARDWARE CONNECTIONS
Auxiliary sensor channels can be accessed using a sensebox unit (XS-271), connected to the BIPOLAR IN port at the back of the eegoTM amplifier. The sensor starter kit contains the following sensors:
|
Sensor |
Product code |
|
Respiration |
XS-351 |
|
Temperature |
XS-352 |
|
GSR |
XS-353 |
|
Accelerometer |
XS-354 |
Each sensor comes with a 5-pin binder connector which can be connected to any of the dedicated AUX ports of the sensebox unit. Auxiliary sensors require power to operate, therefore a 5V power supply (e.g. power bank) must be connected to the micro-USB power port of the sensebox. The system ground is supplied by the GND electrode on the participant’s EEG cap. If the AUX sensor data are being collected independently (no EEG data), a GND electrode should be connected to the dedicated port on the sensebox. A total of up to four XS-271 sensebox modules can be cascaded to each other to acquire multiple bipolar and auxiliary sensors in one session. For additional information on the hardware set-up please consult the app note “Sensors for eegoTM, pt.1: Hardware and software configuration” and the datasheet for Sensebox XS-271.
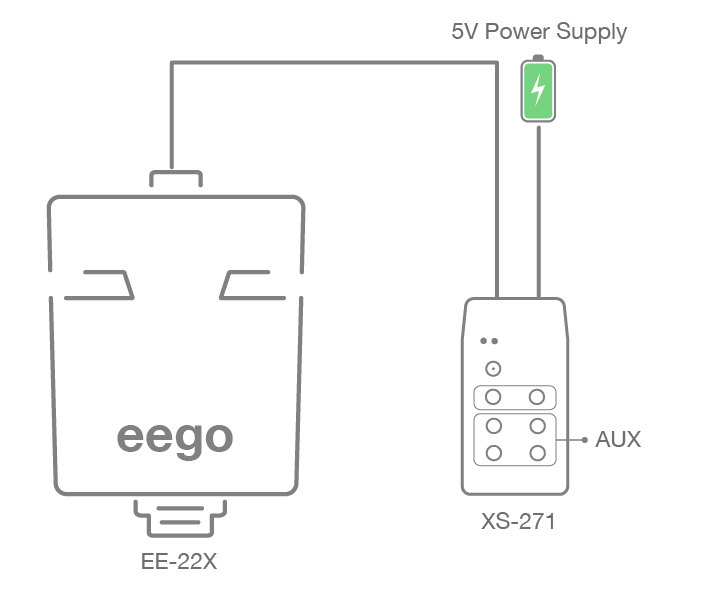
Figure 1 – Example of hardware set-up for the acquisition of physiological data with AUX sensors. The sensebox unit XS-271 is connected to the BIP port of the eego™ EE-22X amplifier and powered through an external power bank.
SOFTWARE CONFIGURATION
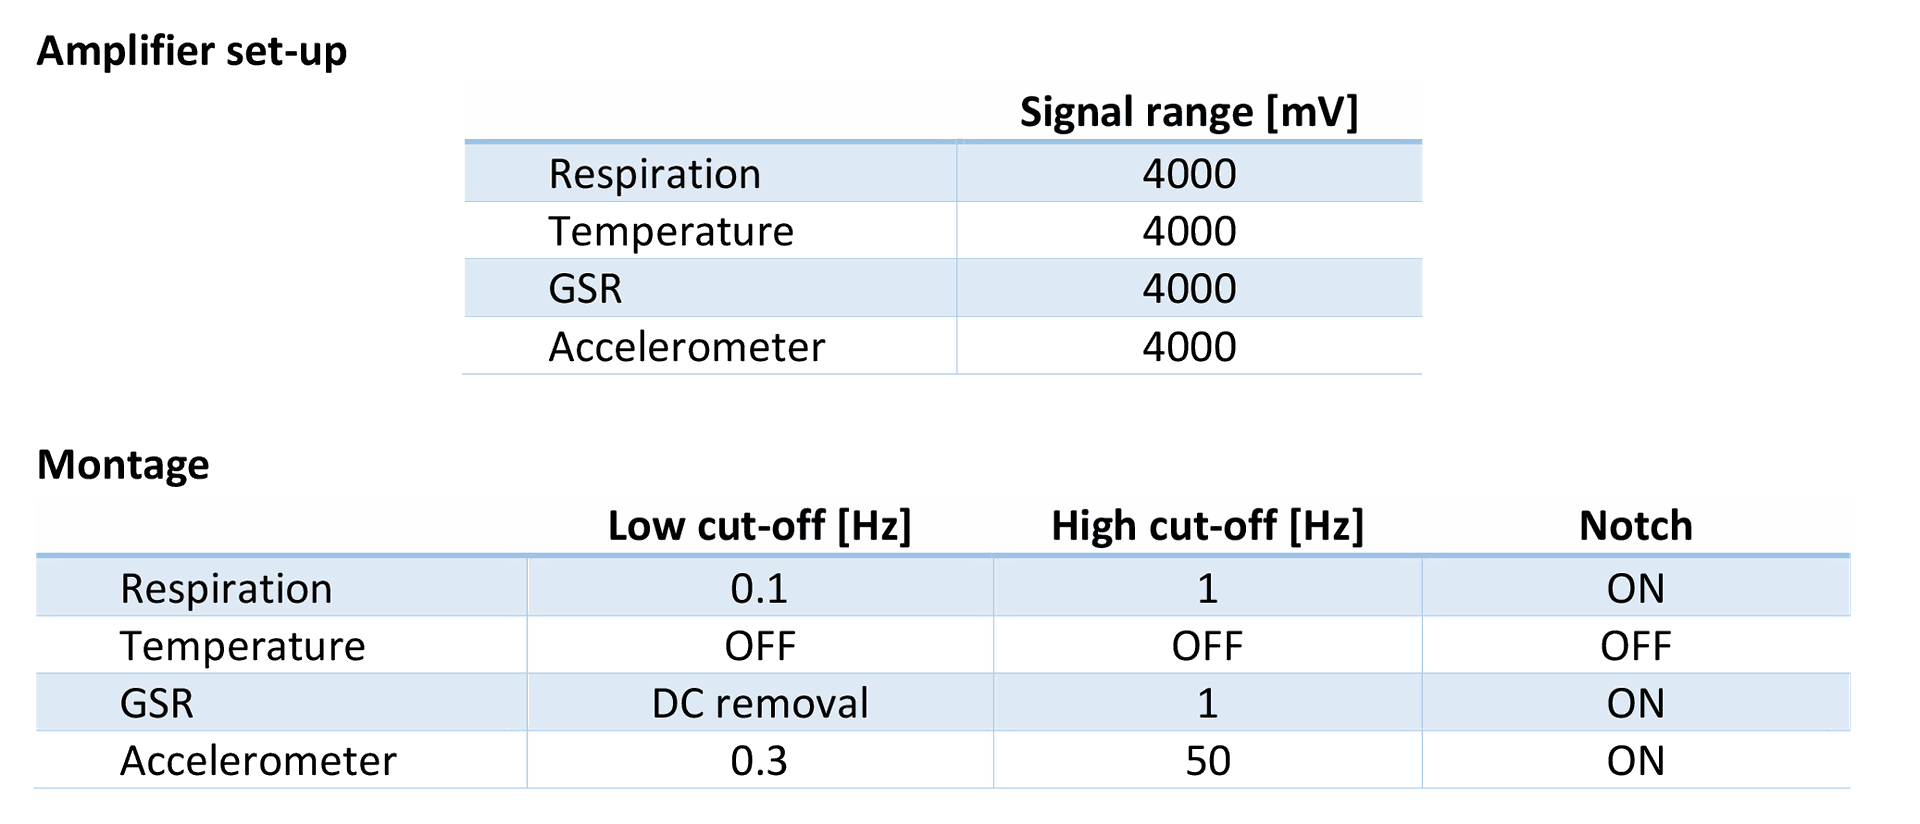
The tables below provide recommended values for each of the auxiliary sensors which are included in the sensor starter kit, to be used during the configuration of the experimental set-up in eegoTM software.
In the amplifier set-up, the signal range (amplifier gain) can be defined to prevent the saturation of the traces in case of high amplitude signals. For some AUX sensors (GSR and accelerometer), this is automatically set to the wider signal range of 4000mV. In the amplifier set-up, it is also possible to edit the calibration points of each sensor. Unless required by the specific experimental conditions, it is recommended to stick to default values for optimal accuracy of the signals. The list of sensors in the amplifier set-up should reflect the order of the physical connections to the AUX ports of the Sensebox. This depends on the Sensebox variant being used (A, B, C or D); channel numbers are indicated next to each port (variant A: channels 3 to 6; B: 9 to 12; etc.)
The montage allows for the customization of visualization parameters such as bandpass and notch filter, as well as trace colors. For more details on the definition of amplifier set-up and montage, please consult the Application Note: Sensors for eego, pt.1 – Hardware and software configuration. Please note that, when AUX sensors are included in the session, the sampling frequency of the recording is limited to a maximum of 8kHz.
Note: eego™ software handles multiple sensor types and the visualization interface has been built to synchronously visualize both EEG and bipolar/auxiliary channels. Visualization parameters such as filters and amplitude scale are optimized for EEG traces, certain AUX sensor (specifically small, slow-changing signals like temperature and GSR) although fully functional, might have visualization limitations resulting in apparently almost-flat traces. For an optimal visualization of AUX signals, it is recommended to export and plot the data in a data analysis platform (e.g. ASA, Matlab, etc.) which allows full flexibility in the analysis and visualization parameters.
RESPIRATION
Respiration sensors monitor breathing patterns and rates by detecting thoracic or abdominal expansion. They are crucial for studying respiratory function in relation to stress, sleep, and disorders. Combined with EEG, they provide insights into brain-respiratory interactions, supporting applications in stress monitoring, sleep analysis, and cognitive research.
Characteristics of Respiration Signals
Respiration sensors measure changes in thoracic or abdominal circumference as the subject inhales and exhales, using piezoelectric elements, inductive bands, or strain gauges embedded in an elastic band. The signal reflects respiratory rate (breaths per minute) and depth, with a frequency range of 0.1 Hz to 1 Hz, reflecting the slow and periodic nature of the respiratory cycle. These sensors capture irregularities like apneas or shallow breathing and are critical for identifying respiratory artifacts and understanding the influence of breathing on brainwave activity in multimodal EEG systems.
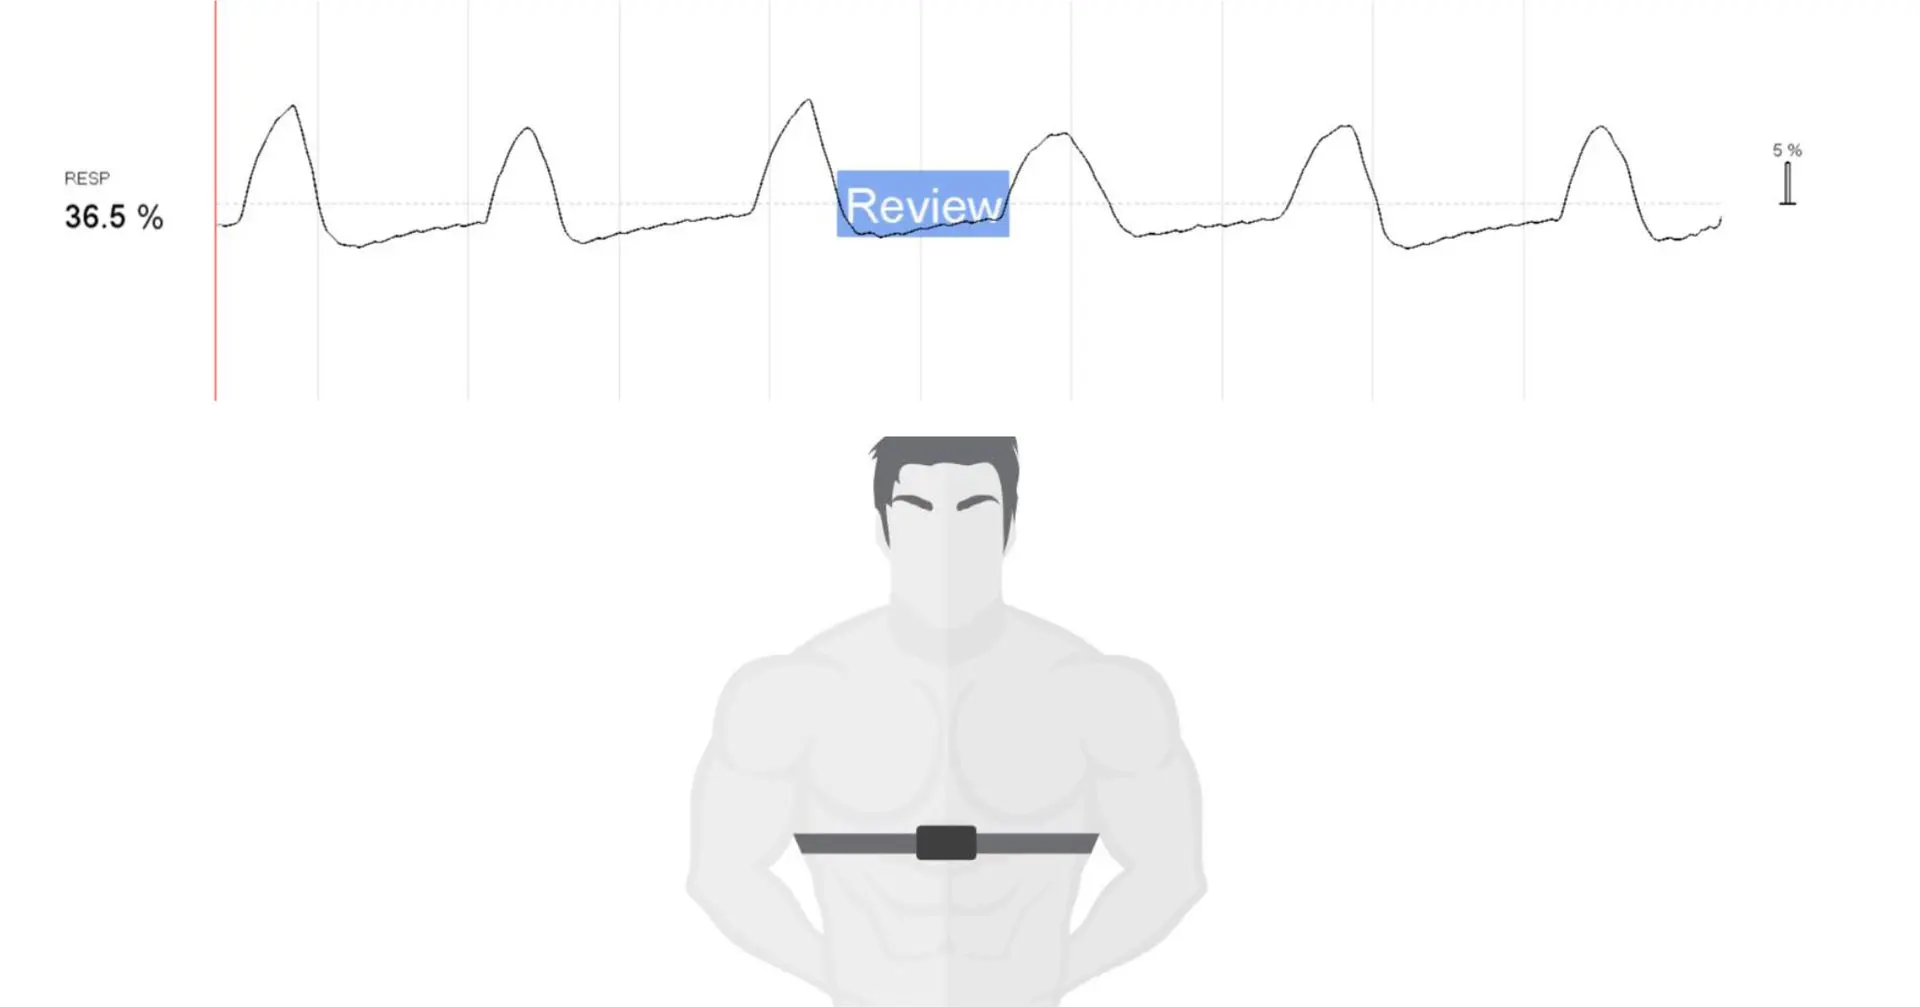
Figure 2 – Top: An example of respiration trace over ~60s , indicated as percentage of the maximal thoracic expansion. The peaks in the signal reveal the pattern of inhalation and exhalation. Bottom: placement of the respiration band across the chest.
Benefits and Applications of Combined EEG-Respiration Recordings
Integrating respiration data with EEG provides a comprehensive view of the relationship between neural activity and respiratory function. This combination is useful in a variety of applications, including:
- Stress and Relaxation Research: Monitoring breathing patterns alongside EEG can provide insights into how stress or relaxation techniques, such as mindfulness and deep breathing, influence brain activity and autonomic nervous system responses.
- Sleep Studies: Respiration sensors are essential for identifying sleep apnea and other respiratory irregularities during sleep. Combined with EEG, they help differentiate between sleep stages and correlate respiratory disturbances with brainwave patterns.
- Cognitive Workload and Performance: EEG-respiration recordings can be used to study how cognitive tasks impact breathing, providing insights into physiological responses to mental workload or anxiety.
- Clinical Respiratory Research: Combining EEG and respiration monitoring is valuable for studying conditions such as asthma, chronic obstructive pulmonary disease (COPD), or panic disorders, where respiratory and neural components are interconnected.
Placement and Best Practices for Respiration Sensor Use
Proper setup and placement of respiration sensors are critical to obtaining high-quality signals. Below are guidelines to ensure accurate respiration monitoring:
- Sensor Placement: Position the band snugly around the chest or abdomen, depending on the type of breathing pattern you wish to monitor (thoracic or diaphragmatic). For most applications, chest placement is preferred for measuring upper respiratory effort, while abdominal placement is ideal for lower respiratory effort.
- Tightness of the Band: The sensor should be secure but not overly tight to avoid discomfort or restriction of natural breathing. Ensure the band maintains consistent contact throughout the breathing cycle to capture changes in expansion and contraction accurately.
- Minimizing Noise and Artifacts: Movement artifacts can interfere with respiration signals. Ask the subject to remain still during recordings and minimize unnecessary body movements. Secure the sensor and its cables to avoid displacement.
- Signal Calibration: Perform a baseline calibration before starting the recording to ensure the sensor accurately reflects the subject's normal breathing rate and amplitude. Instruct the subject to take a few deep breaths during calibration to adjust the signal range. The default average values should be suitable for most subjects. If the trace appears to saturate, increase the voltage range; if the trace appears almost flat, decrease the voltage range.

- Signal unit: The recorded respiration signal is computed in relation to the maximum expansion/contraction of the chest, and can be displayed as Percentage [%], Permille [‰], or normalized Value [0, 1].
By following these best practices, respiration sensors can provide reliable and meaningful data. When combined with EEG, these sensors allow researchers and clinicians to explore the complex interactions between breathing patterns and brain activity, contributing to advancements in areas like neurophysiology, sleep medicine, and stress management.
TEMPERATURE
Temperature sensors measure skin temperature to track thermoregulatory processes linked to stress, relaxation, and circadian rhythms. Integrated with EEG, they provide valuable data on brain-body interactions, supporting research in emotional regulation, fatigue monitoring, and sleep studies.
Characteristics of Temperature Signals
Using thermistors or thermocouples, these sensors detect temperature changes by measuring variations in electrical resistance or voltage. Skin temperature signals are low-frequency (<0.1 Hz) and stable, reflecting changes in blood flow due to autonomic activity, complementing EEG data in multimodal analysis.
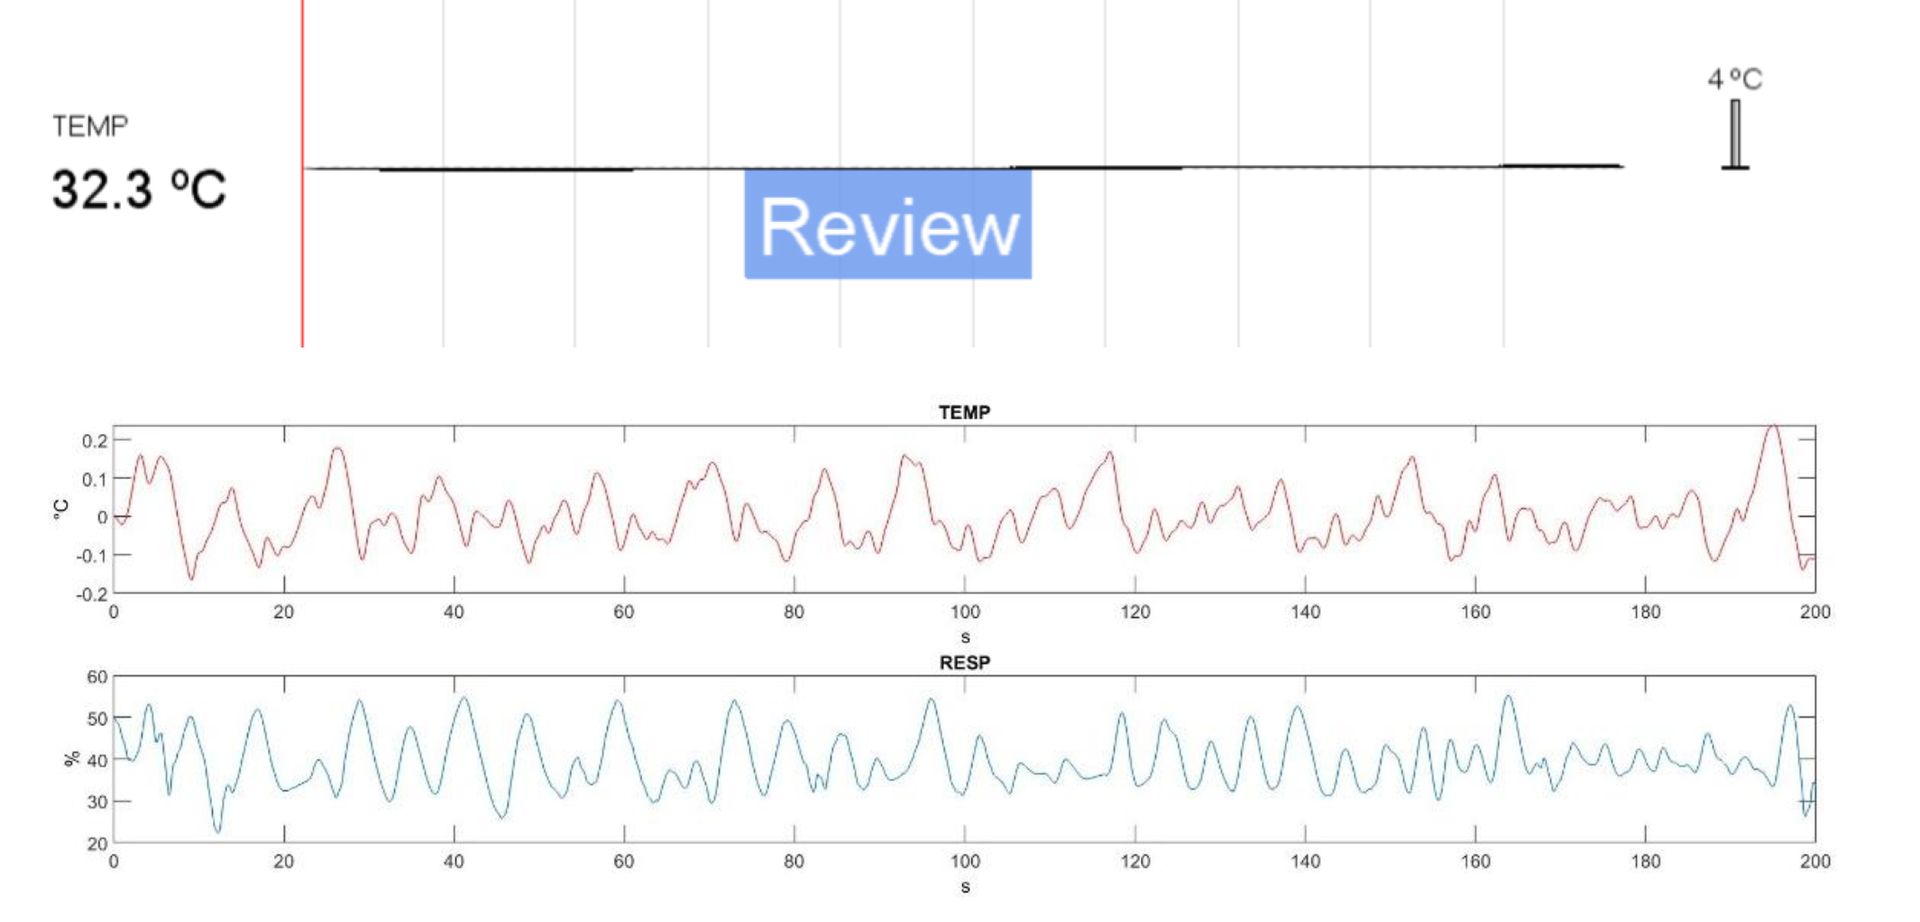
Figure 3 – Top panel: Live temperature values are displayed in eego during the recording (left side of the screen). The signal trace itself is generally too slow-changing to be able to appreciate temperature variations within the visualization window. Bottom panel: to derive meaningful information, we therefore recommend elaborating temperature values in post-processing, after the export of the data. The temperature channel can be, for example, correlated with other sensors used in parallel. In the reported example, temperature data collected by placing the sensor below the nostrils have been exported from eego into Matlab, filtered between [0.01-0.5Hz] (to isolate the slow changing temperature pattern) and correlated with data from the respiration sensor.
Benefits and Applications of Combined EEG-Temperature Recordings
The integration of temperature sensors with EEG systems enables comprehensive monitoring of physiological responses in various contexts:
- Stress and Relaxation Research: Skin temperature correlates with stress and relaxation states, providing insights into autonomic responses alongside EEG data.
- Sleep Studies: Monitoring temperature alongside EEG helps study circadian rhythms and sleep quality, as skin temperature changes during different sleep stages.
- Fatigue and Performance Monitoring: Combined EEG-temperature data can assess fatigue-related decreases in alertness, critical in occupational or athletic performance.
- Clinical and Emotional Research: Temperature signals help evaluate conditions like anxiety or hot flashes, providing context for EEG findings.
Placement and Best Practices for Temperature Sensor Use
Accurate placement and setup are essential for reliable temperature recordings:
- Sensor Placement: Attach the sensor to a stable skin area, such as a fingertip, wrist, or forehead, depending on the study’s focus.
- Secure Attachment: Use adhesive patches or medical tape to ensure consistent skin contact and avoid displacement.
- Avoid External Influences: Minimize exposure to external heat sources, drafts, or physical activity that might affect skin temperature.
By adhering to these guidelines, temperature sensors provide high-quality data that, when combined with EEG, deepens understanding of brain-body interactions in diverse applications.
GSR
GSR sensors measure changes in skin conductance, which vary with sweat gland activity controlled by the autonomic nervous system. They are widely used for assessing emotional arousal, stress, and engagement. Combined with EEG, GSR data provides insights into how cognitive and emotional states influence brain activity, supporting research in psychophysiology, stress monitoring, and human-computer interaction.
Characteristics of GSR Signals
GSR sensors work by passing a small, imperceptible electrical current through the skin and measuring changes in conductance, which increase with sweat gland activation. GSR signals typically have two components:
- Tonic Component: Reflects baseline skin conductance, associated with long-term physiological states like relaxation or stress.
- Phasic Component: Represents rapid changes in response to stimuli, such as emotional triggers or cognitive challenges.
These signals are low-frequency and require amplification to capture subtle variations, making them suitable for integration with EEG systems for multimodal analysis. 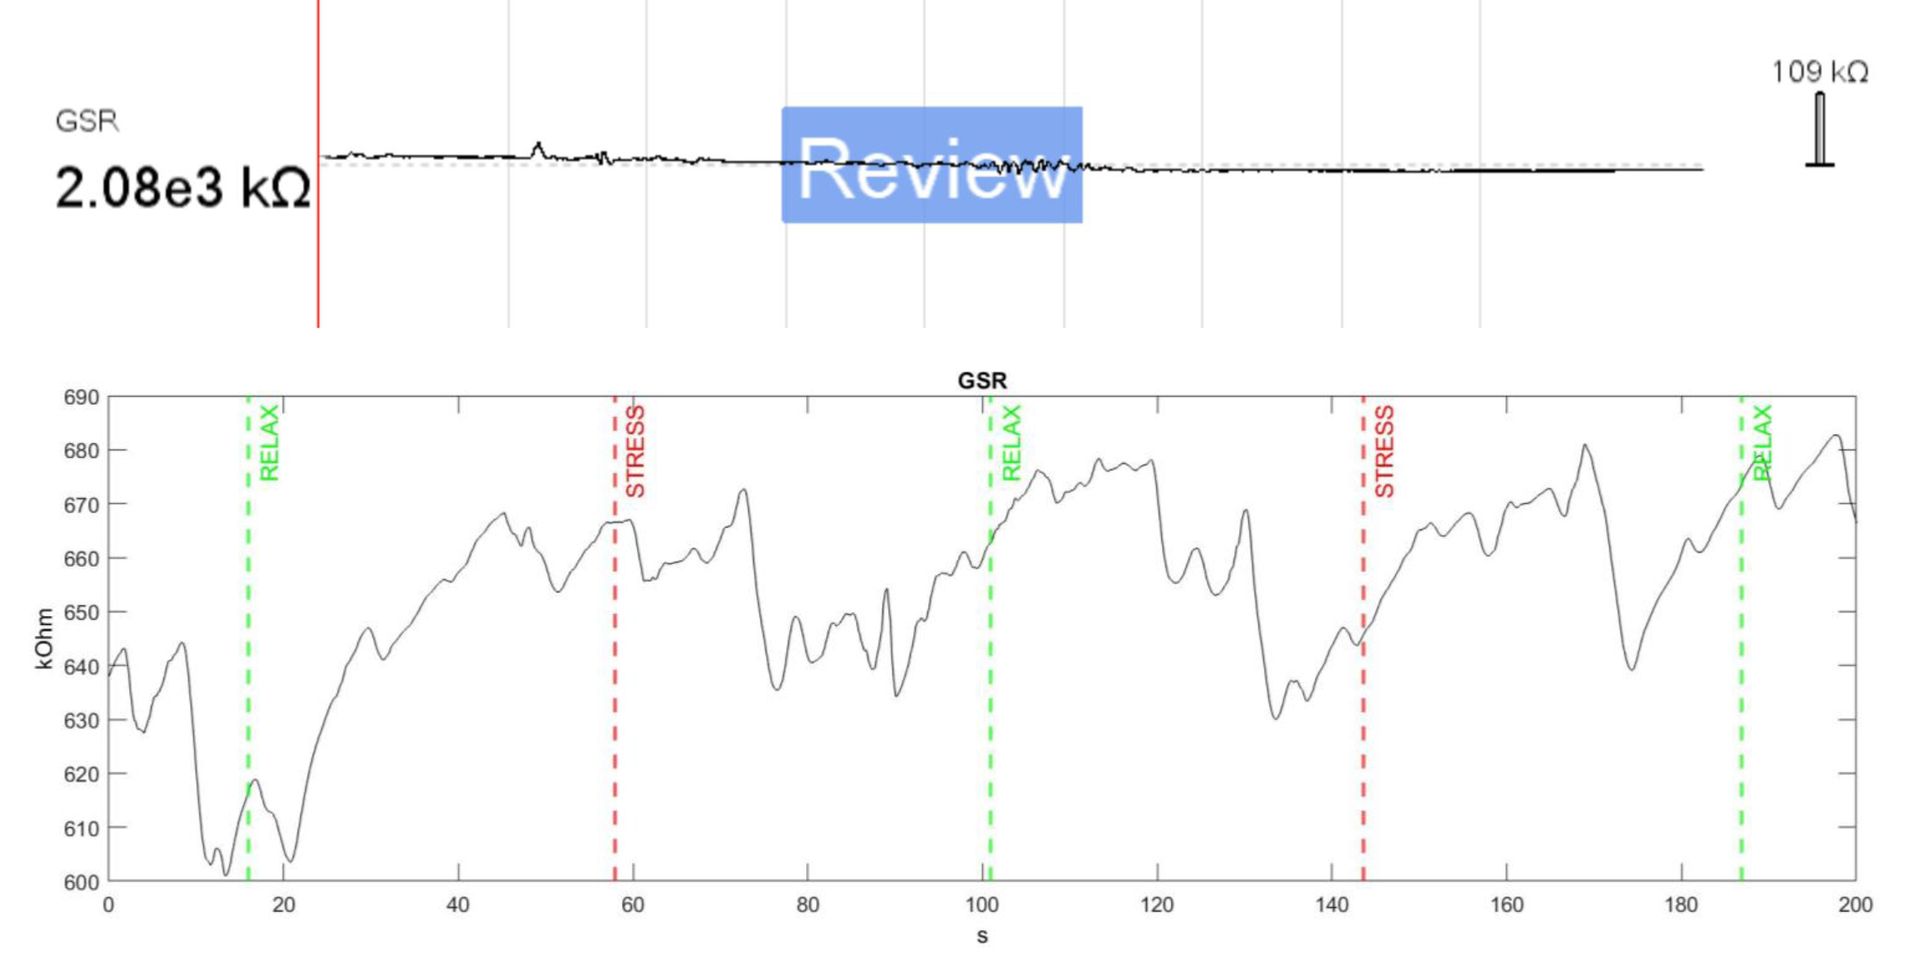
Figure 4- Top panel: similarly to temperature, GSR is a slow-changing signal which is not easy to appreciate in the visualization window. However, actual GSR values are displayed during the recording in eego (left-hand side of the screen). Bottom panel: After exporting and analyzing the GSR values we can derive meaningful conclusions from the data. The panel shows an example of GSR data collected during a task with visual stimuli inducing a relaxing or stressful response. The signal was filtered with a low-pass filter at 1Hz and smoothed with a rolling average calculated over a 1s window.
Benefits and Applications of Combined EEG-GSR Recordings
GSR combined with EEG enhances the understanding of the brain’s role in emotional and autonomic regulation. Applications include:
- Emotional Research: Measuring responses to emotional stimuli, such as images, sounds, or events, to study the relationship between brain activity and arousal.
- Stress Monitoring: GSR and EEG data together can differentiate between stress-induced cognitive and physiological responses.
- Human-Computer Interaction: Evaluating user engagement and emotional states in real-time, particularly in gaming or interface design.
- Clinical Applications: Investigating disorders like anxiety, PTSD, or phobias by correlating brain activity with autonomic arousal.
Placement and Best Practices for GSR Sensor Use
Placement: Attach electrodes to fingers or palms for optimal sweat gland detection.
- Skin Prep: Clean skin with alcohol to reduce impedance.
- Attachment: Use Velcro straps or adhesive pads for secure contact.
- Minimizing Artifacts: Limit hand movements during recording.
These practices ensure reliable GSR data, enhancing multimodal studies of brain-body interactions.
ACCELEROMETER
Accelerometer sensors measure motion, acceleration, and orientation, providing critical data on physical activity and body movements. They are essential in understanding movement-related artifacts in EEG recordings and studying motor control, postural stability, and physical activity patterns. When integrated with EEG, accelerometers enable researchers to correlate neural activity with physical motion, supporting applications in biomechanics, rehabilitation, and human-computer interaction.
Principles of Accelerometer Signals
Accelerometers detect acceleration forces acting on the sensor along one or more axes (X, Y, Z). These forces can be due to gravity, movement, or vibrations. The sensor outputs data as continuous signals or discrete events, typically in units of g-force (gravitational force). Multiaxial accelerometers provide three-dimensional motion data, enabling detailed analysis of movement patterns.
In EEG systems, accelerometer signals are crucial for identifying and correcting movement artifacts, ensuring cleaner neural recordings.
Benefits and Applications of Combined EEG-Accelerometer Recordings
The integration of accelerometers with EEG supports a range of applications, including:
- Artifact Correction: Detect and remove motion artifacts from EEG data for improved signal quality.
- Motor Control Research: Study brain-movement coordination, such as in gait analysis or motor learning.
- Rehabilitation and Assistive Devices: Monitor neural and physical activity to optimize rehabilitation protocols or control prosthetic devices.
- Human Performance Analysis: Assess physical activity and its impact on cognitive function in occupational, athletic, or clinical settings.
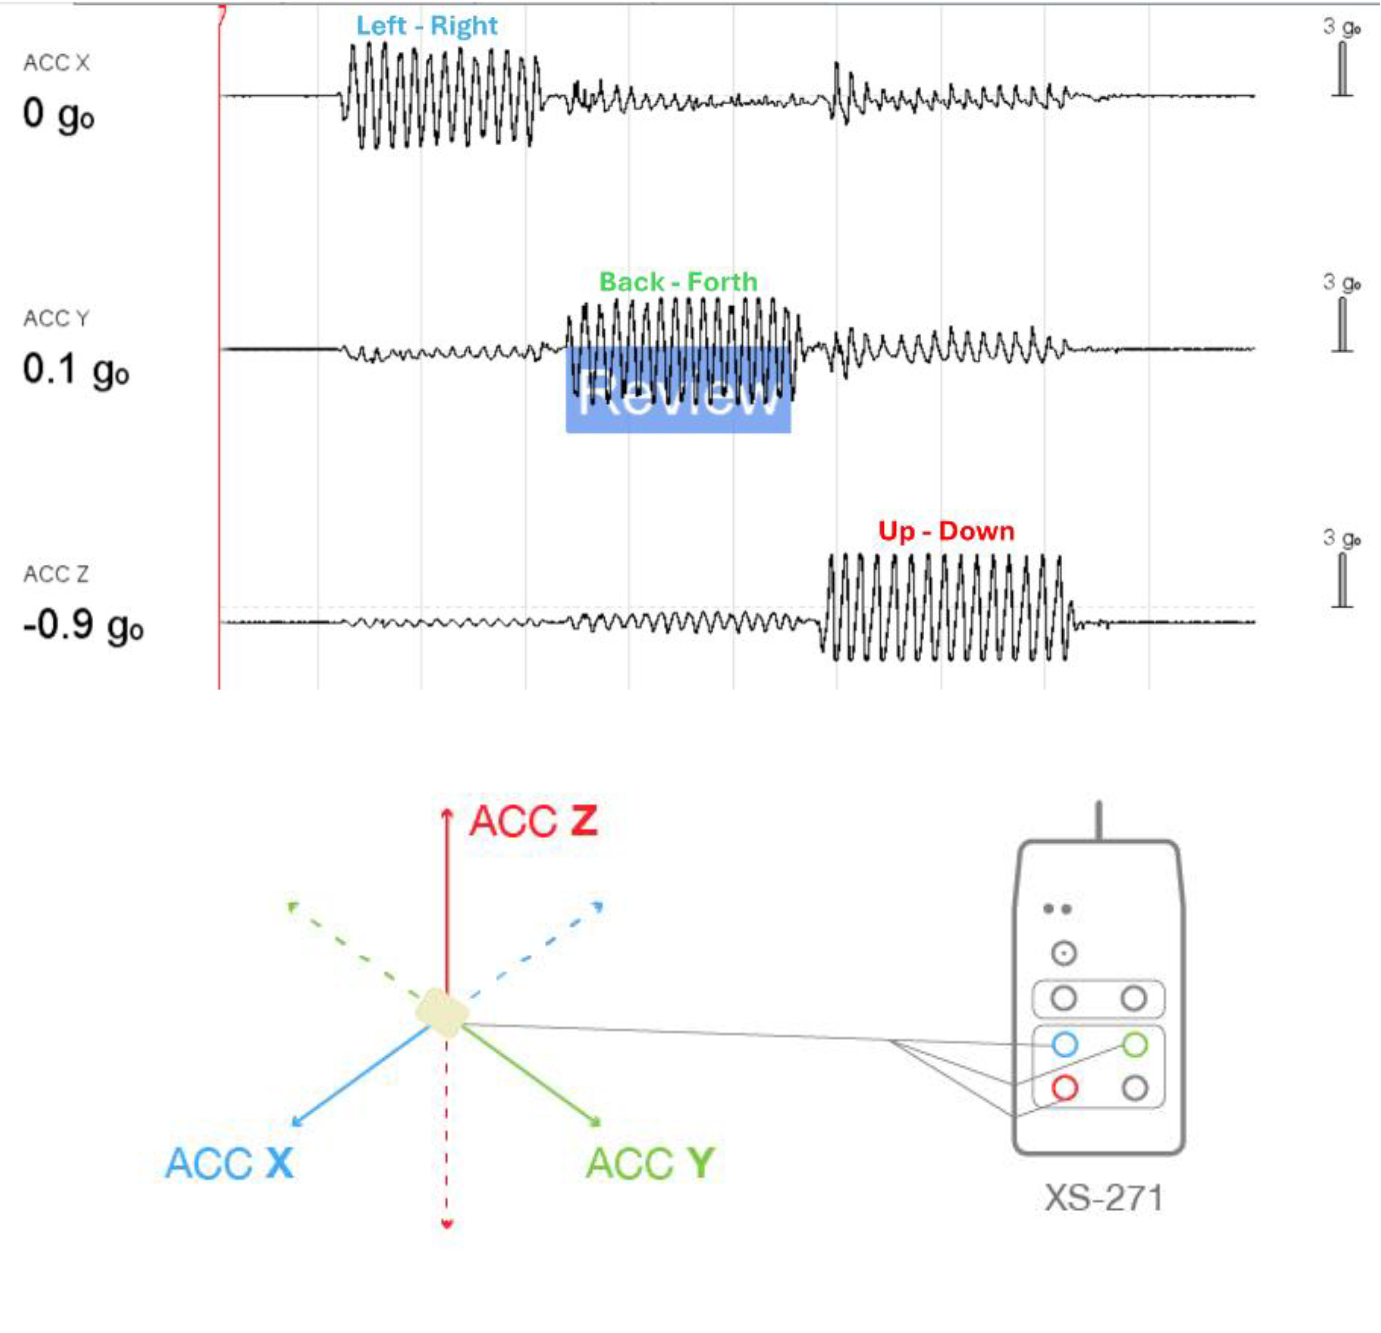
Figure 5 – The accelerometer sensor connects to three AUX ports of the sensebox XS-271, one for each of the three directions of motions recorded (in this example: port 3 – ACC X, corresponding to Left-right motion; port 4 – ACC Y, corresponding to back-forth motion, port 5 – ACC Z, corresponding to up-down motion).
Placement and Best Practices for Accelerometer Sensor Use
Proper placement and setup of accelerometer sensors are critical for accurate data acquisition. Follow these guidelines:
- Sensor Placement: Position the sensor on a stable location relative to the movement being studied (e.g., wrist for arm movement, chest for whole-body motion, or head for EEG artifact detection).
- Attachment: Secure the sensor firmly using straps, adhesive pads, or wearable bands to prevent displacement during motion.
- Minimize External Noise: Avoid placing the sensor in areas prone to excessive vibrations or external shocks that could distort the data.
By adhering to these practices, accelerometer sensors provide reliable motion data that, when combined with EEG, enhances the understanding of the relationship between brain activity and physical movement across various research and clinical applications.
DISCLAIMER
All information provided in this document is intended as a summary only.
For detailed product related information please always consult the latest version of the respective product’s user manual. This document is not intended to replace the user documentation. For indications on individual feature certification status (clinical vs. research only) please refer to the aforementioned user documentation.
We have attempted to write this document as accurately as possible. However, mistakes are bound to occur, and we reserve the right to make changes whenever needed or whenever new information becomes available.
All product names and brand names in this document are trademarks or registered trademarks of their respective holders.
© Copyright 2025 eemagine Medical Imaging Solutions GmbH.
No part of this document may be photocopied or reproduced or transmitted in any way without prior written consent from eemagine Medical Imaging Solutions GmbH.